One-sentence summary
Conscious engagement is high-dimensional, recovery is low-dimensional, and poor-prognosis coma reflects pathological failure of the injured brain to downshift into restorative low-dimensional dynamics.
Abstract
Consciousness is usually defined by behavior, reportability, or spectral brain rhythms, but the dimensionality of the underlying brain dynamics remains poorly specified. Here we introduce brain oscillator intrinsic dimension (BOID): an intrinsic dimension of brain time series defined as the number of active exposinusoidal oscillatory degrees of freedom recovered from multichannel Hankel-delay embeddings by singular-spectrum analysis and ESPRIT pole extraction. We test a regime-switching hypothesis of consciousness: conscious engagement is high-dimensional and resource-demanding; healthy recovery and efficient control are low-dimensional; and poor-prognosis coma reflects pathological failure to downshift from high-dimensional overactivation into restorative low-dimensional dynamics.
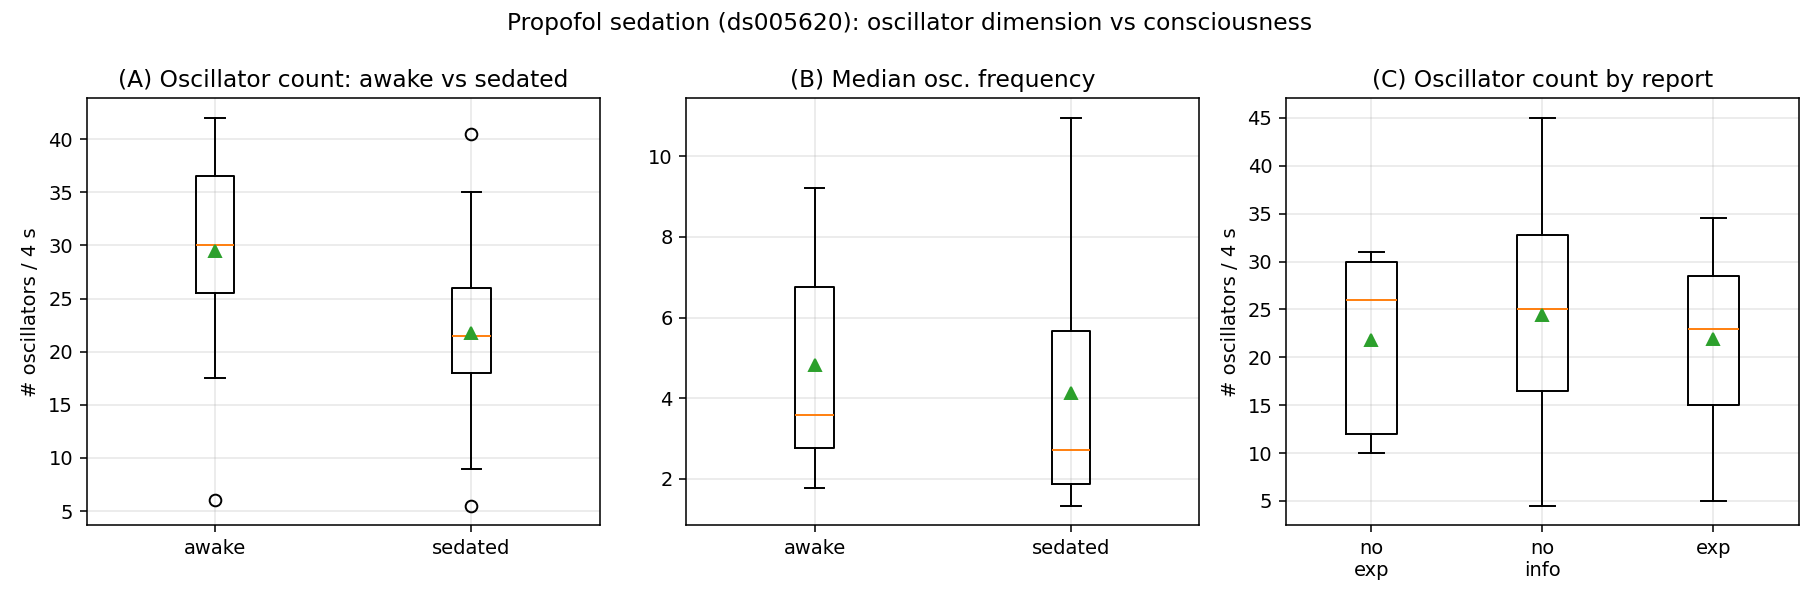
Across independent datasets spanning human sleep, mouse sleep, and propofol anesthesia, reversible suppression of consciousness was accompanied by a robust reduction in BOID. In Sleep-EDF, oscillator count decreased monotonically from wakefulness to deep slow-wave sleep (median 18 to 4 modes per 4-s window, ), a pattern reproduced across individual nights and confirmed by independent fractal, graph-based, Hankel-rank, and topological estimators. Mouse non-REM sleep replicated the low-dimensional sleep state across species. Propofol sedation similarly reduced BOID relative to wakefulness (30.5 to 21.5 modes, ), despite the organized propofol alpha signature, showing that BOID measures the size of the active oscillator repertoire rather than the power of any single frequency band.
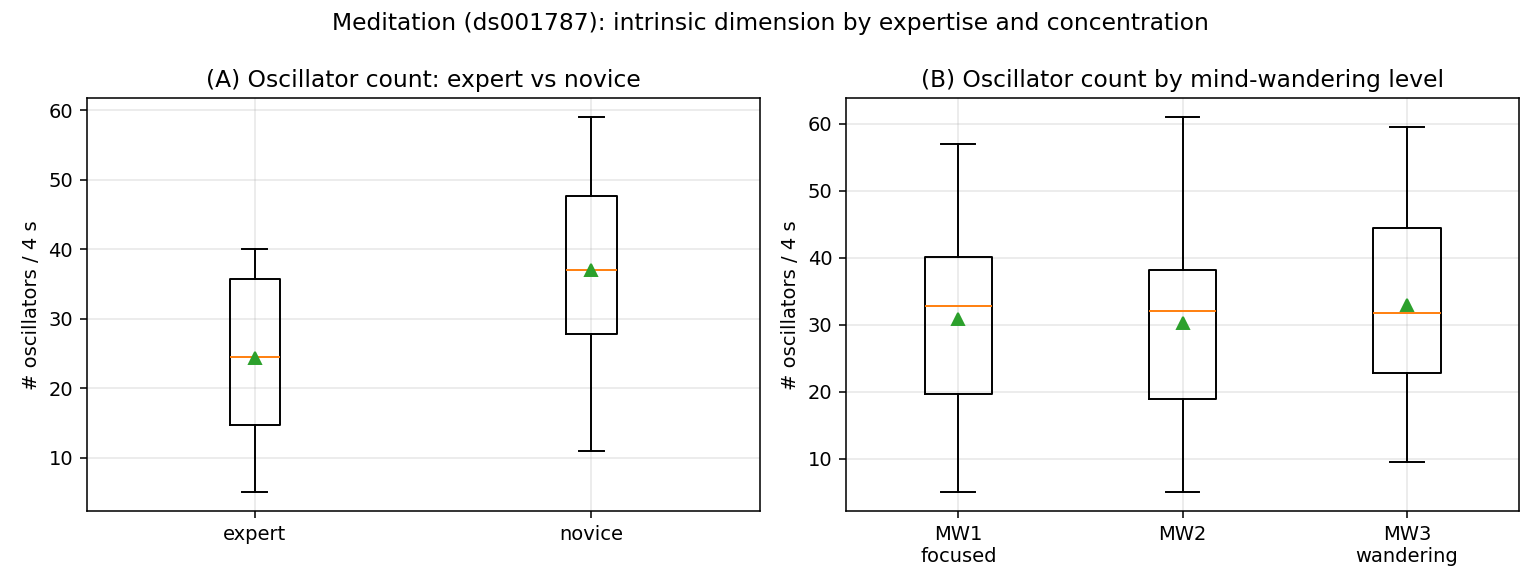
Low dimensionality was not pathological. Expert meditators showed lower intrinsic dimension than novices, indicating that trained mental states can be maintained with fewer active dynamical degrees of freedom. We therefore interpret deep sleep, anesthesia, and expert meditation as organized low-dimensional recovery or efficiency modes: states in which conscious access narrows while the brain enters a more synchronized, economical, and controllable regime.
Post-anoxic coma exposed the pathological boundary of this mechanism. In 575 I-CARE patients, poor neurological outcome was associated with elevated BOID and a pathological mode-proliferation index combining high mode count, high-frequency poles, burst intermittency, and mode-frequency entropy (PMPI AUC 0.67, ). Thus, high dimensionality in coma did not indicate preserved consciousness; it marked hyperexcitable, fragmented dynamics and failure of the injured brain to enter a protective low-dimensional recovery state. Incorporating BOID into a multimodal prognostic pipeline with intrinsic-dimension, spectral/burst, and clinical features yielded leakage-free coma-outcome prediction comparable to state-of-the-art models (AUC 0.81), while preserving mechanistic interpretability.
These results identify BOID as a geometric marker of brain-state regime. Conscious wakefulness is high-dimensional; healthy recovery and expert control are low-dimensional; and poor-prognosis coma is a failure of dimensional regulation. Brain oscillator dimensionality therefore provides a single interpretable read-out linking sleep, anesthesia, meditation, and coma.
Introduction
Consciousness is an active, resource-demanding brain state. It requires the brain to maintain a broad repertoire of possible perceptions, actions, memories, predictions, and internal simulations. We propose that this repertoire has a measurable dynamical signature: high oscillator dimensionality. In the Bernadotte oscillator framework, a brain signal is represented as a superposition of active exposinusoidal modes, and the intrinsic dimension of the brain time series is estimated as the number of dynamically independent oscillatory degrees of freedom required to generate the observed signal. Conscious wakefulness should therefore correspond to a high-dimensional oscillatory regime.
The opposite state is not simply failure. Healthy brains repeatedly enter low-dimensional regimes. Deep sleep, sedation, and some forms of trained meditative stabilization reduce conscious access, but they also reduce metabolic and dynamical load. These states are slower, more synchronized, and more economical. We therefore interpret low oscillator dimensionality as a recovery mode of the healthy brain: a state in which the conscious repertoire narrows so that the system can stabilize, restore, and prepare for future high-dimensional activity.
This view differs from a monotonic complexity theory in which “more complexity” is always better. High oscillator dimensionality can be functional or pathological depending on context. In the intact brain, high dimensionality supports conscious interaction, cognitive flexibility, and mental effort. In the injured brain, especially after anoxic damage, high dimensionality may instead reflect pathological mode proliferation: epileptiform activity, burst-like fragmentation, high-frequency poles, myoclonus, and metabolically costly hyperexcitability. Poor-prognosis coma may therefore result not from low dimensionality itself, but from the failure to enter an organized low-dimensional recovery mode.
This interpretation is consistent with the physiology of sleep and anesthesia. Deep non-REM sleep is dominated by slow synchronized activity, and propofol anesthesia replaces awake high-frequency, low-amplitude EEG with structured alpha and slow-delta oscillations. Excessive anesthetic depth can produce burst suppression, a pattern also observed in anoxic coma and epilepsy [1, 2]. Thus, reversible loss of consciousness is not merely “less brain activity.” It is an organized dynamical downshift. The central question is whether the brain can enter and leave this low-dimensional state appropriately.
To formalize this question, we introduce brain oscillator intrinsic dimension (BOID), extending our previous topology-driven framework for time-series classification, where the intrinsic dimension and geometry of delay embeddings were proposed as invariants of the underlying dynamics and were linked to the number of latent dynamical components [3]. Here, we specialize this principle to brain time series by defining BOID as the number of active exposinusoidal oscillatory degrees of freedom recovered from multichannel Hankel embeddings.
BOID is based on the Bernadotte exposinusoidal model of brain signals [4, 5, 6]. A multichannel recording is embedded as a Hankel trajectory [7, 8, 4, 5]. In the exposinusoidal model, the observed signal is represented as a finite superposition of damped oscillatory components,
where each component has a spatial projection , frequency , phase , damping or growth parameter , and noise or unresolved activity . Multichannel singular-spectrum analysis (MSSA) [4, 5, 8, 6] followed by ESPRIT pole extraction [9] estimates these components. We interpret the recovered mode count as BOID: an intrinsic dimension of the reconstructed trajectory and an estimate of the active oscillatory degrees of freedom.
The Bernadotte oscillator model is complementary to classical oscillator, spiking-neuron, and information-theoretic frameworks. In relation to Kuramoto-type models, it treats large-scale brain activity as an observable superposition of coupled oscillatory modes, but instead of prescribing only phase synchronization within a predefined oscillator population [10, 11], it estimates from data the active damped exposinusoidal components, including their frequencies, phases, damping parameters, and shared multichannel projections. In relation to Izhikevich-type models, it does not attempt to reproduce the full microscopic spike-generating dynamics of individual neurons [12, 13]; rather, it provides a mesoscopic inverse model of the collective oscillatory degrees of freedom visible in EEG or neurointerface signals. From the viewpoint of information theory, BOID can be interpreted through the principle of minimum description length [14, 15]: among competing reconstructions of the signal, the relevant brain-state descriptor is the smallest set of oscillatory modes that explains the observed dynamics with sufficient accuracy. Thus, BOID measures the effective complexity of the brain state as the minimal oscillatory description required to encode its dynamics, linking coupled-oscillator theory, spiking-neuron dynamics, and information-theoretic model selection.
Oscillator dimensionality is distinct from spectral power
BOID is conceptually distinct from conventional spectral-band measures such as alpha, theta, or delta power. Band power quantifies how much signal energy falls within a predefined frequency range. For example, alpha power measures the amplitude or energy of EEG activity near 8–13 Hz. BOID instead estimates how many dynamically independent oscillatory modes are required to generate the observed brain signal. It is therefore a measure of the size of the active oscillator repertoire, not the strength of any single rhythm.
This distinction is essential for interpreting sleep and anesthesia. A brain state can show strong organized alpha or slow-delta activity while having low BOID, because the signal is dominated by a small number of synchronized oscillatory generators. Conversely, active wakefulness or cognitive effort may suppress alpha power while increasing BOID, because the brain recruits a broader set of independent oscillatory degrees of freedom. Thus, BOID does not ask which frequency band is strongest; it asks how many oscillatory degrees of freedom are active.
In this sense, BOID provides a geometric and dynamical descriptor that is complementary to spectral analysis. Spectral power describes the distribution of energy across frequencies. BOID describes the dimensionality of the latent oscillatory system that generates the signal. This allows BOID to capture regime changes that are not reducible to alpha power, delta dominance, or any single frequency-band amplitude.
BOID as a marker of consciousness and recovery-mode switching
We test this hypothesis across open brain time-series datasets spanning physiological sleep, cross-species sleep, pharmacological anesthesia, expert meditation, and post-anoxic coma. Human and mouse sleep test whether unconscious recovery states are low-dimensional across species. Propofol anesthesia tests whether pharmacological suppression of consciousness reduces oscillator dimensionality. Meditation tests whether trained mental states can enter a low-dimensional efficient regime while awake. Coma tests whether the injured brain fails to downshift into this recovery mode and whether oscillator dimensionality can contribute to prognosis.
Our results support a regime-switching model of consciousness. Wakefulness is high-dimensional. Sleep and anesthesia are low-dimensional recovery states. Expert meditation is a low-dimensional efficient waking state, consistent with reduced resource expenditure by a trained brain. Poor-outcome coma is characterized by pathological high-dimensional overactivation and failure of recovery-mode downshifting. Finally, we show that BOID is not only interpretable but prognostically useful: when fused with other geometric, spectral, burst-suppression, and clinical features, it contributes substantially to a high-performing model of coma outcome.
Results
Conscious wakefulness is high-dimensional and deep sleep is a low-dimensional recovery mode
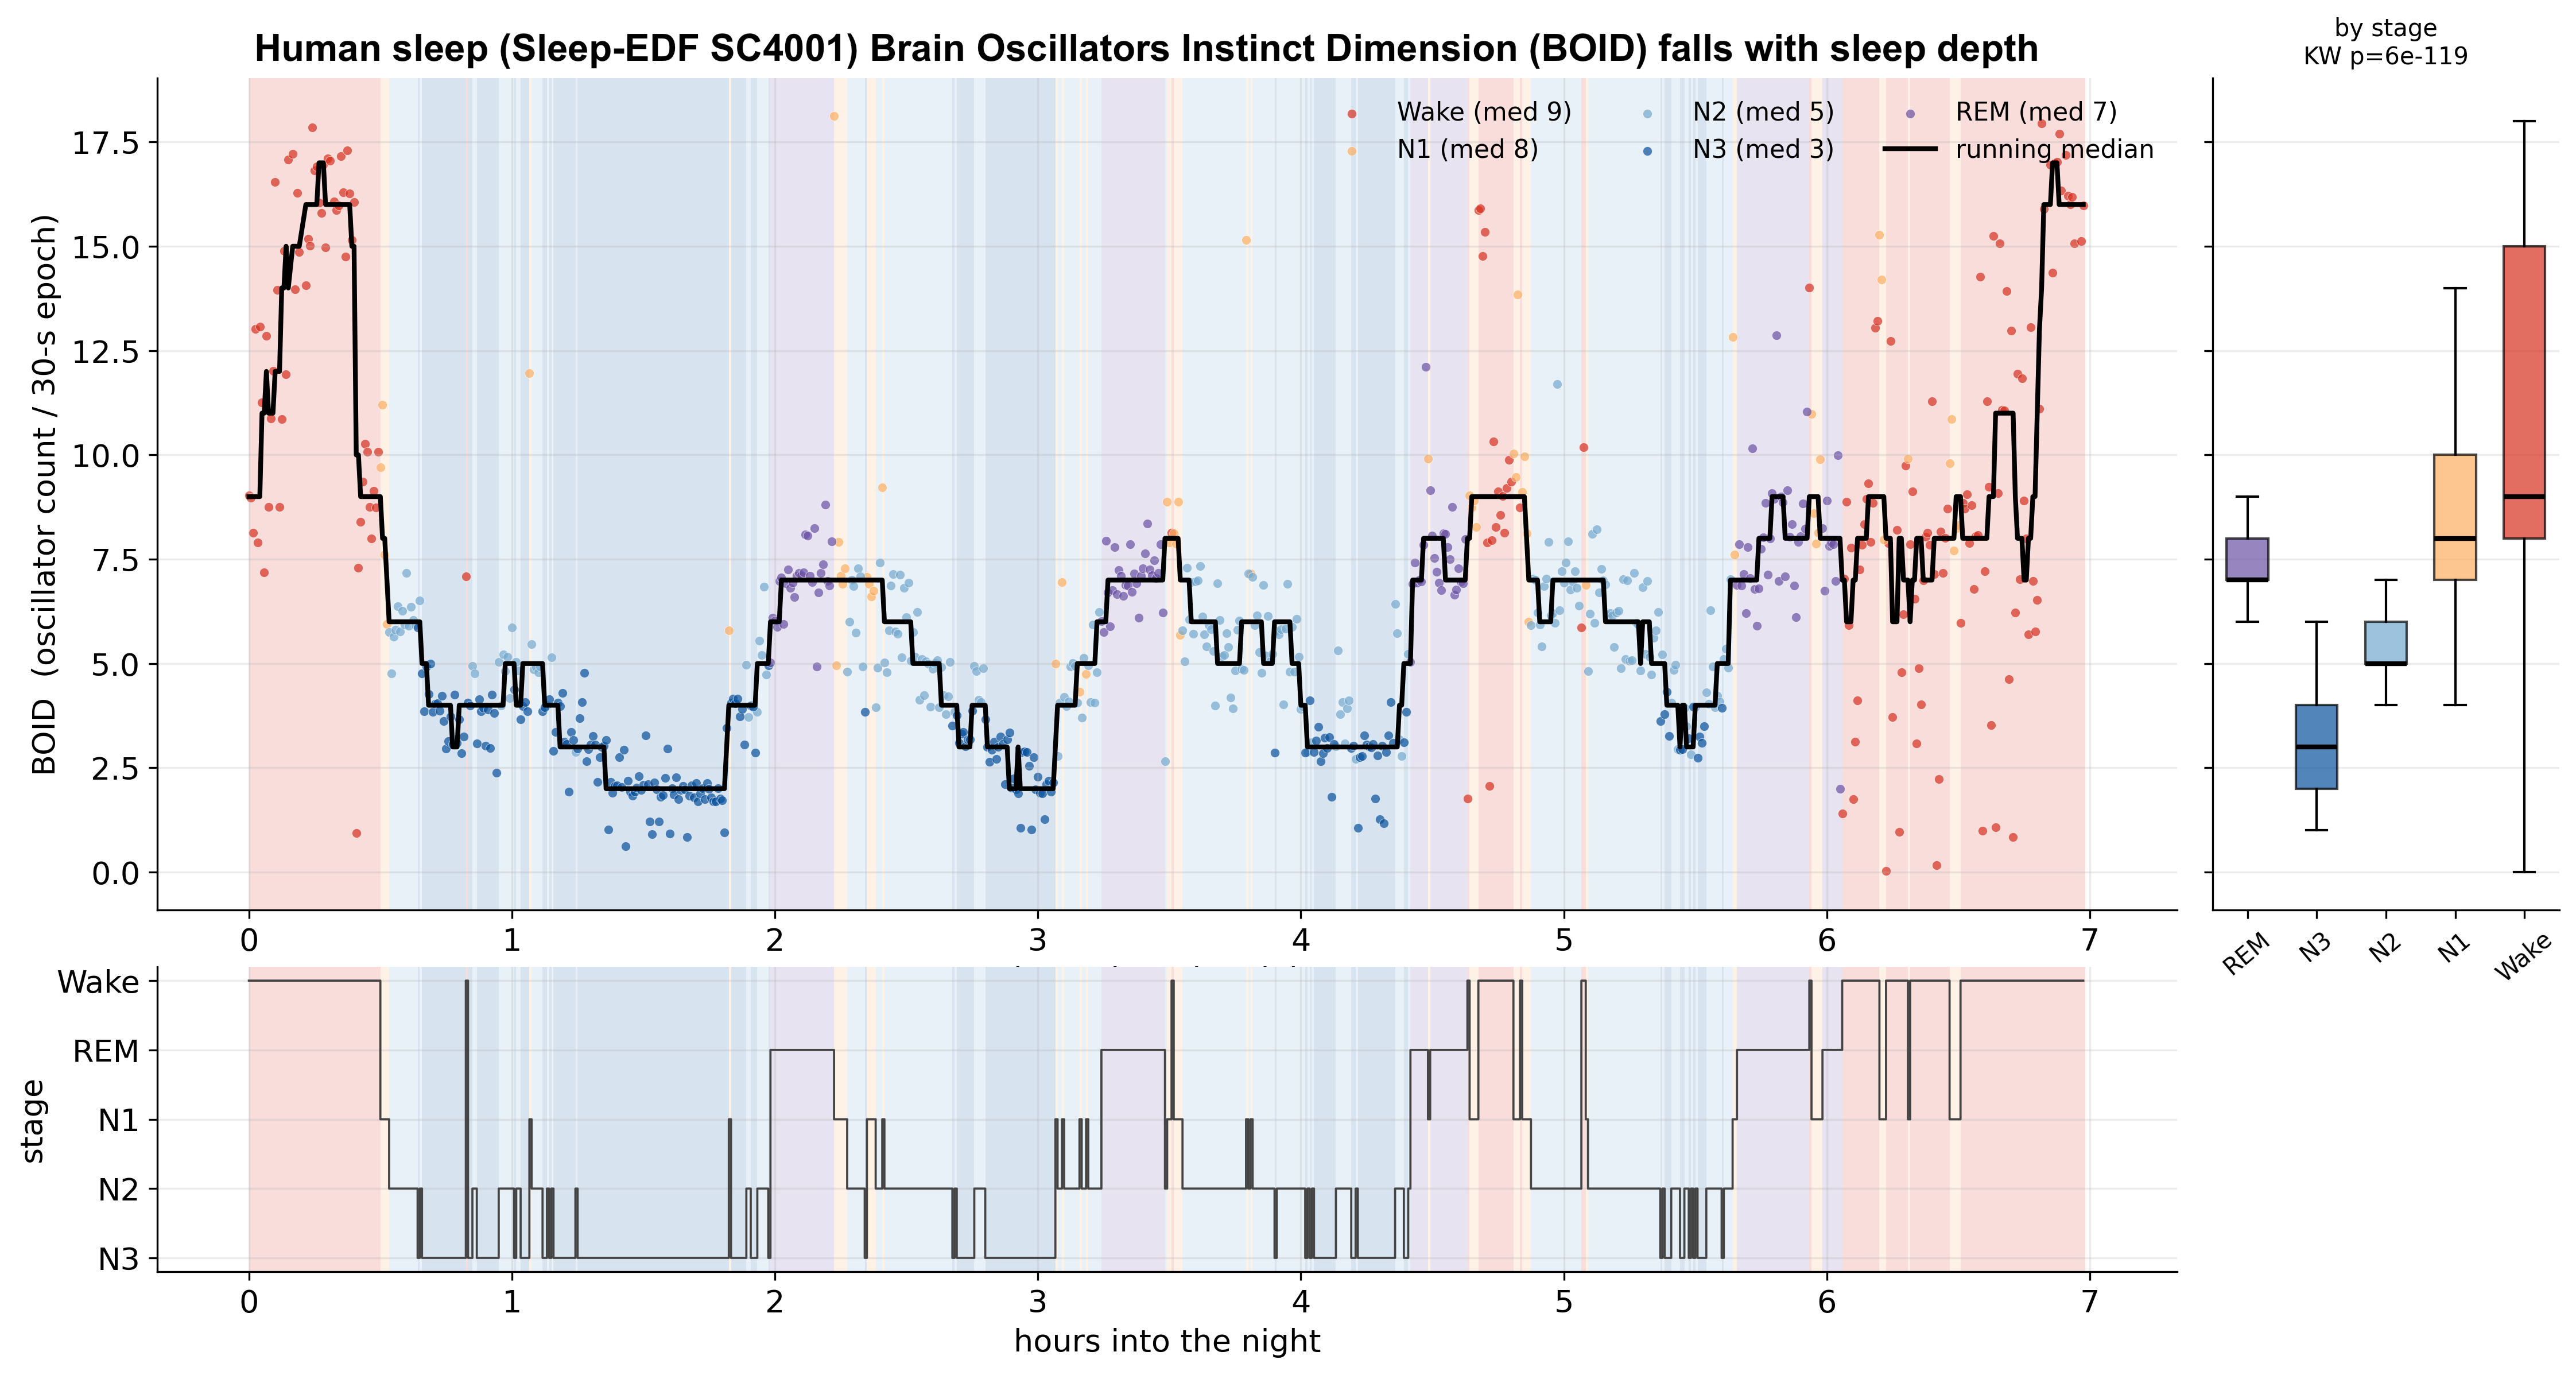
Sleep provides a natural within-brain experiment in dimensional regime switching. Across the Sleep-EDF cohort, brain oscillator intrinsic dimension (BOID) reproducibly decreased with sleep depth. Wakefulness showed the highest oscillator dimensionality, progressively deeper NREM stages showed a stepwise reduction, and N3 slow-wave sleep reached the lowest values. This monotonic decline was observed across subjects rather than being driven by isolated recordings, indicating that BOID behaves as a robust marker of consciousness level during physiological sleep. In this interpretation, the transition from wakefulness to deep sleep corresponds to a reproducible downshift from a high-dimensional conscious regime into a low-dimensional recovery mode.
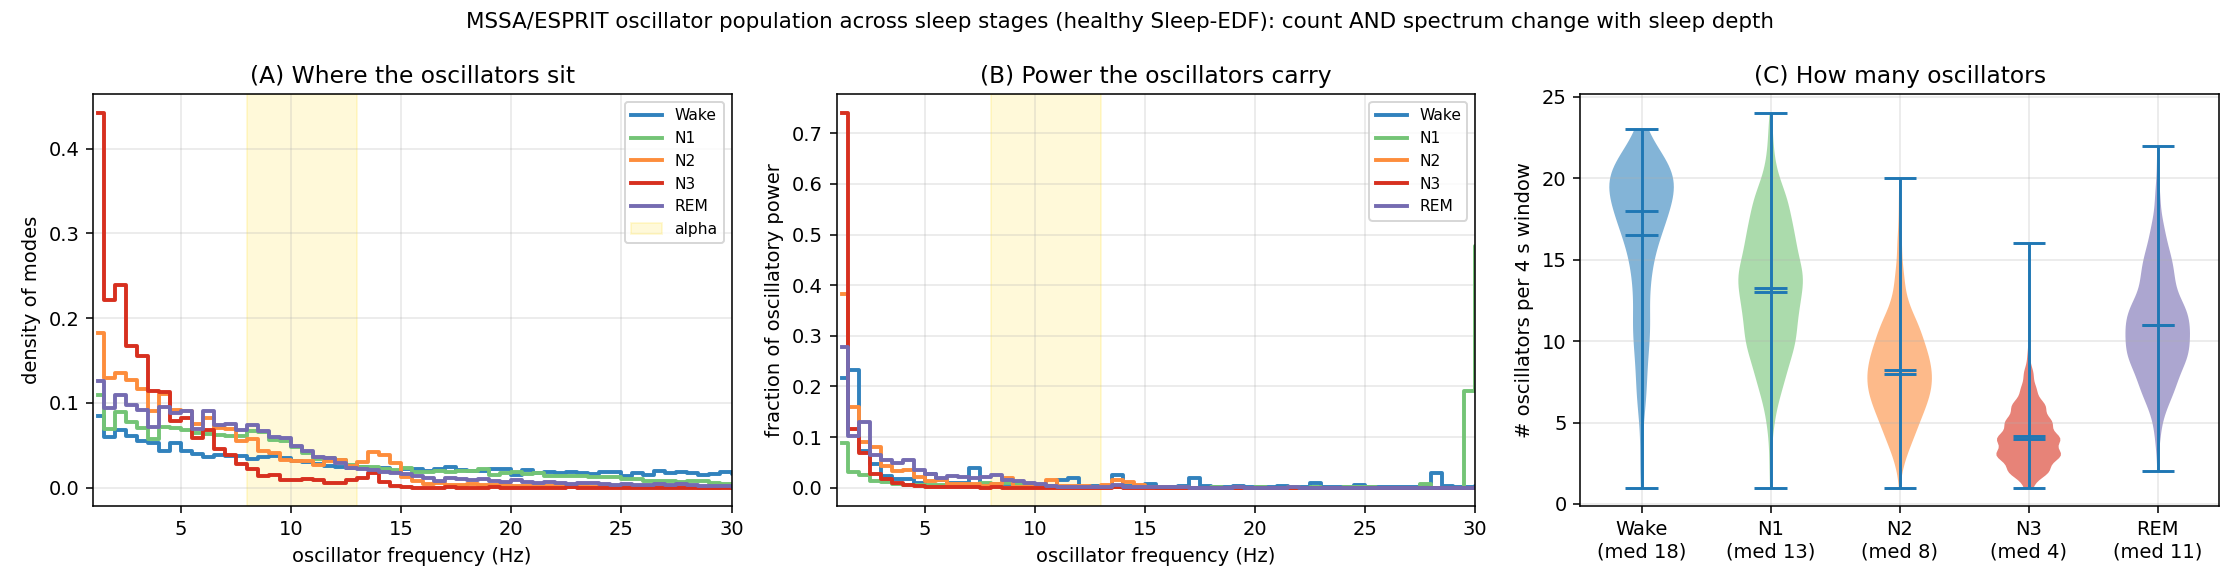
We analyzed Sleep-EDF Expanded recordings using MSSA/ESPRIT extraction across expert-scored sleep stages. The analyzed subset comprised 10 subjects, 5,535 four-second windows, and 56,282 extracted oscillatory modes. The oscillator population changed systematically with sleep stage (Figs. 1, 2). Subject-level median BOID decreased from Wake (18) to N1 (13), N2 (8), and N3 (4), whereas REM occupied an intermediate position (11). N1 denotes the lightest transition from wakefulness to sleep, N2 is stable light sleep characterized by sleep spindles and K-complexes, and N3 is deep slow-wave sleep dominated by delta activity. The stage effect was highly significant (Kruskal–Wallis , ).
This result supports the first thesis of the paper: conscious wakefulness is high-dimensional in terms of BOID. As sleep deepens, conscious access is progressively reduced and the oscillator population contracts. This low-dimensionality is not pathological. In healthy sleep, it marks a recovery mode. N3 oscillators were concentrated at 1–2 Hz, consistent with delta-dominant slow-wave sleep, whereas wakefulness showed the broadest frequency distribution and extended into the 15–30 Hz range. Oscillatory power during sleep was dominated by slow activity, especially in N3 and REM. Thus, deepening sleep produced a coordinated reduction in active oscillatory degrees of freedom and a redistribution of activity toward slow restorative dynamics.
This pattern was reproducible across individual whole-night recordings rather than being driven by a single subject or pooled-window statistics (Fig. S10).
Independent estimators confirm the low-dimensional state of deep sleep
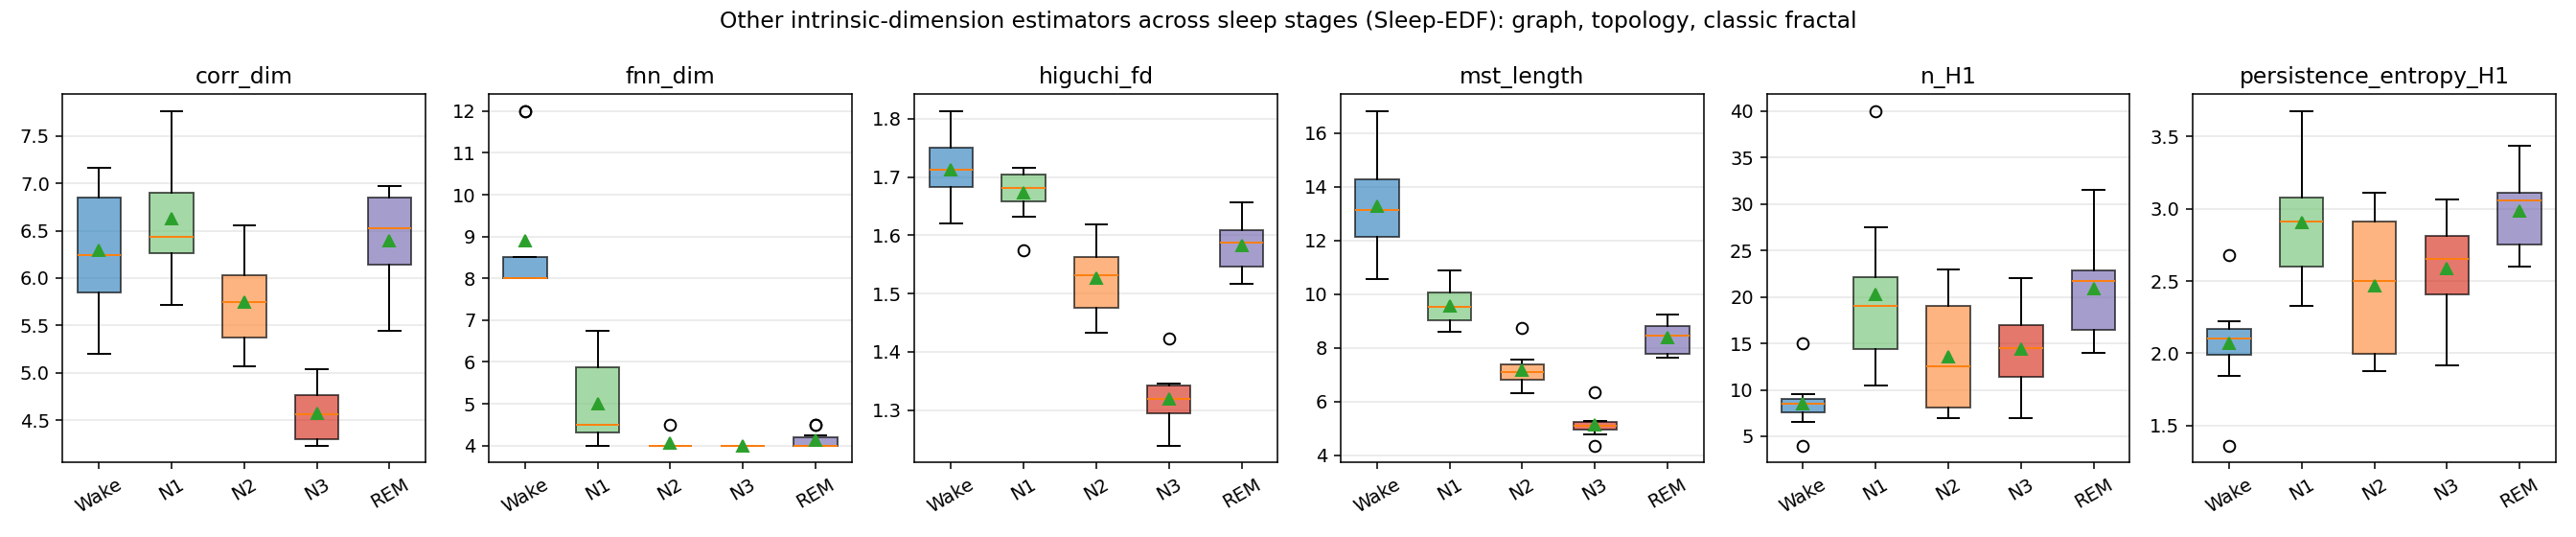
To test whether the sleep-depth effect depended specifically on the Hankel-spectral oscillator representation of BOID, we computed an independent intrinsic-dimension battery on the same Sleep-EDF subjects [16, 17, 18, 19]. Scalar estimators from distinct mathematical families converged on the same conclusion: N3 slow-wave sleep was the lowest-dimensional regime (Fig. 3; Table 1). Correlation dimension, false-nearest-neighbor embedding dimension, Higuchi fractal dimension, minimum-spanning-tree length, and Brito–Quiroz–Yukich degree all reached their minima in N3. Because these estimators probe different representations of the data, including raw single-channel signals and multichannel delay-embedded trajectories, their agreement provides convergent evidence that sleep-related dimensional downshifting is not an artifact of the BOID extraction pipeline.
Topological descriptors revealed a complementary axis of sleep organization. First-homology loop count and persistence entropy peaked in REM rather than in N3. REM therefore occupied an intermediate scalar-dimensional regime but showed richer cyclic trajectory structure, consistent with internally active sleep. Thus, scalar dimensionality and topology separate two different properties of sleep dynamics: N3 is low-dimensional and restorative, whereas REM is topologically richer and internally structured.
Family Estimator Wake N2 N3 REM
Fractal Correlation dimension 6.25 5.75 4.56 6.53 Fractal False-nearest-neighbor 8.0 4.0 4.0 4.0 Fractal Higuchi FD 1.71 1.53 1.32 1.59 Graph MST edge length 13.1 7.1 5.1 8.4 Graph BQY degree 11.0 9.5 5.0 10.3 Topology loop count 8.5 12.5 14.5 21.8
: Intrinsic-dimension battery across Sleep-EDF stages. Values are subject-level medians. Scalar estimators are minimized in N3 slow-wave sleep, whereas the topological loop count peaks in REM.
Sleep-related dimensional downshifting is conserved across species
Having established a graded dimensional downshift across human sleep stages, we next asked whether the same effect generalizes beyond humans. We applied the BOID pipeline to OpenNeuro ds006366, the Mouse Sleep Staging Validation dataset, which contains recordings from 92 mice across five laboratories with single-channel cortical EEG and EMG sampled at 128 Hz [20]. Because the integer stage codes were not documented, we identified stages physiologically: the code with maximal delta power was assigned to non-REM sleep, and the code with maximal theta and minimal delta power was assigned to REM.
Despite differences in species, brain size, recording montage, and the use of a single cortical EEG channel, mouse sleep reproduced the human pattern (Fig. 4). BOID was lowest in non-REM sleep, whereas wakefulness and REM occupied higher-dimensional regimes. Median oscillator count decreased from 7 in wakefulness to 6 in non-REM sleep and returned to 7 in REM, with a highly significant stage effect (Kruskal–Wallis ; paired Wake versus non-REM ). Independent single-channel estimators agreed: Higuchi fractal dimension, singular-spectrum entropy, and participation ratio all reached their minima in non-REM sleep.
This cross-species replication indicates that sleep-related dimensional downshifting is not a peculiarity of human EEG montage, Sleep-EDF scoring, or a single dataset. Rather, it reflects a conserved dynamical transition of the mammalian brain into a low-dimensional sleep state. Together with the Sleep-EDF results, the mouse data support the interpretation of non-REM sleep as an organized low-dimensional recovery mode across species.
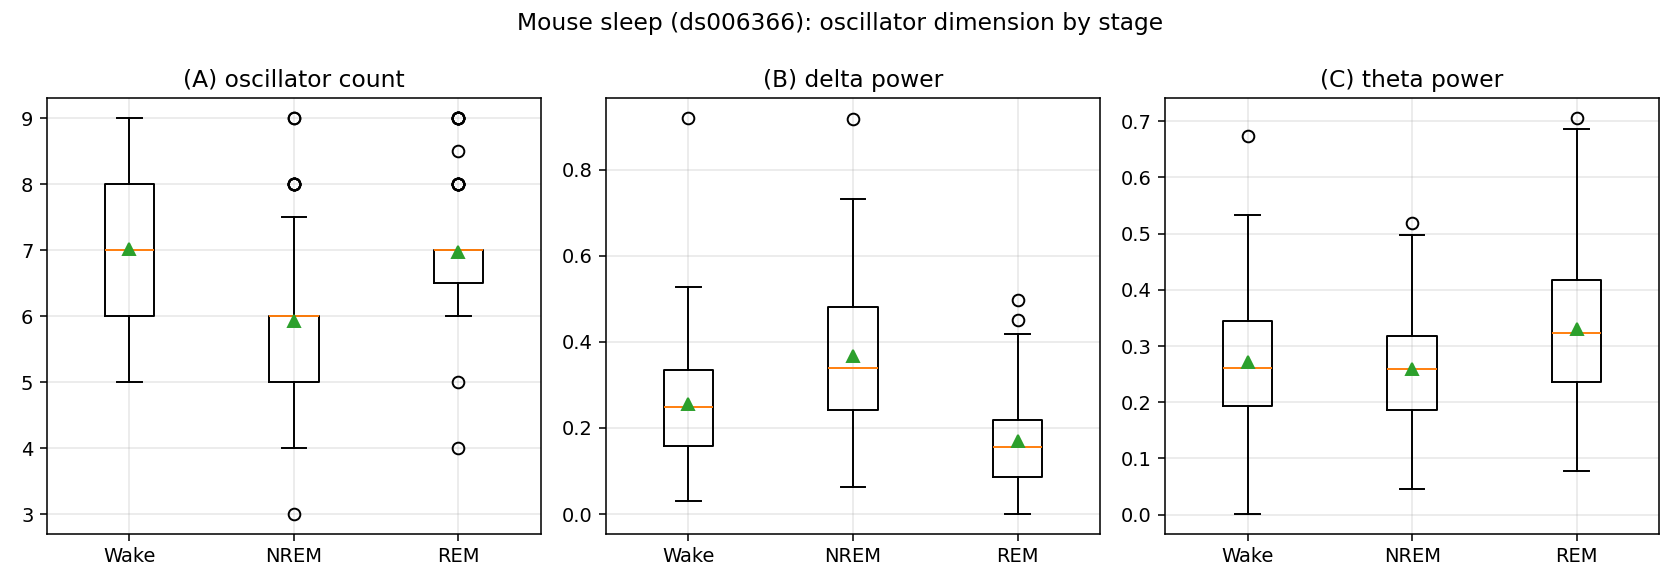
This cross-species pattern was reproducible across individual mouse recordings rather than being driven by a single animal or pooled-epoch statistics (Fig. S11).
Anesthesia lowers BOID during pharmacological suppression of consciousness
Propofol sedation provided a pharmacological test of the same dimensional-switching principle. We analyzed OpenNeuro ds005620, a repeated-awakening propofol study with 21 healthy adults and 65-channel EEG [21]. Within subjects, BOID fell from a median of 30.5 active oscillators per window during wakefulness to 21.5 under sedation (paired Wilcoxon , ; Fig. 5). This reduction occurred together with the canonical propofol EEG signature: anteriorized alpha activity, increased peak alpha frequency, and an increased alpha-to-theta ratio.
The repeated-awakening design allowed us to distinguish the global level of consciousness from the momentary content of experience. Among sedated awakenings, BOID did not separate reports with experience from reports without experience (medians 23 versus 26; Mann–Whitney ). Thus, BOID tracked the global dynamical state of the brain—awake versus sedated—more robustly than the presence or absence of reportable experience within sedation.
These results support the interpretation that high BOID marks conscious, effortful, high-resource brain activity in the intact brain. Propofol suppresses consciousness by shifting the brain into a lower-dimensional, slower, more synchronized regime. As in deep sleep, this low-dimensional state should not be interpreted as pathological collapse; rather, it represents an organized pharmacological downshift of consciousness.
Expert meditation reveals low-dimensional efficient waking control
Low dimensionality does not necessarily mean unconsciousness. We examined the Brandmeyer-Delorme experience-sampling dataset (OpenNeuro ds001787) [22], in which 12 expert and 12 novice meditators were interrupted during meditation and rated their mind-wandering. Experienced meditators showed lower intrinsic dimension than novices across the estimator battery: correlation dimension (6.3 versus 8.9, ), false-nearest-neighbor dimension (4.9 versus 7.4, ), Levina-Bickel estimate (5.9 versus 6.5, ), singular-spectrum entropy (145 versus 172, ), and BOID at trend level (Fig. 6).
Within subjects, reported momentary concentration did not change geometry. None of the thirteen estimators differed across mind-wandering levels, and BOID was nearly unchanged. Intrinsic dimension in this dataset therefore tracked the trait of expertise–a low-dimensional, synchronized control regime–rather than momentary attentional content. This result is essential for the theory. High dimensionality reflects mental tension and resource-demanding conscious activity; trained brains can achieve specialized mental states with fewer active degrees of freedom. Professional meditators therefore appear able to enter a low-dimensional waking recovery or efficiency mode–almost a sleep-like state during wakefulness–rather than a pathological collapse.
Poor-prognosis coma reflects failure to enter low-BOID recovery mode
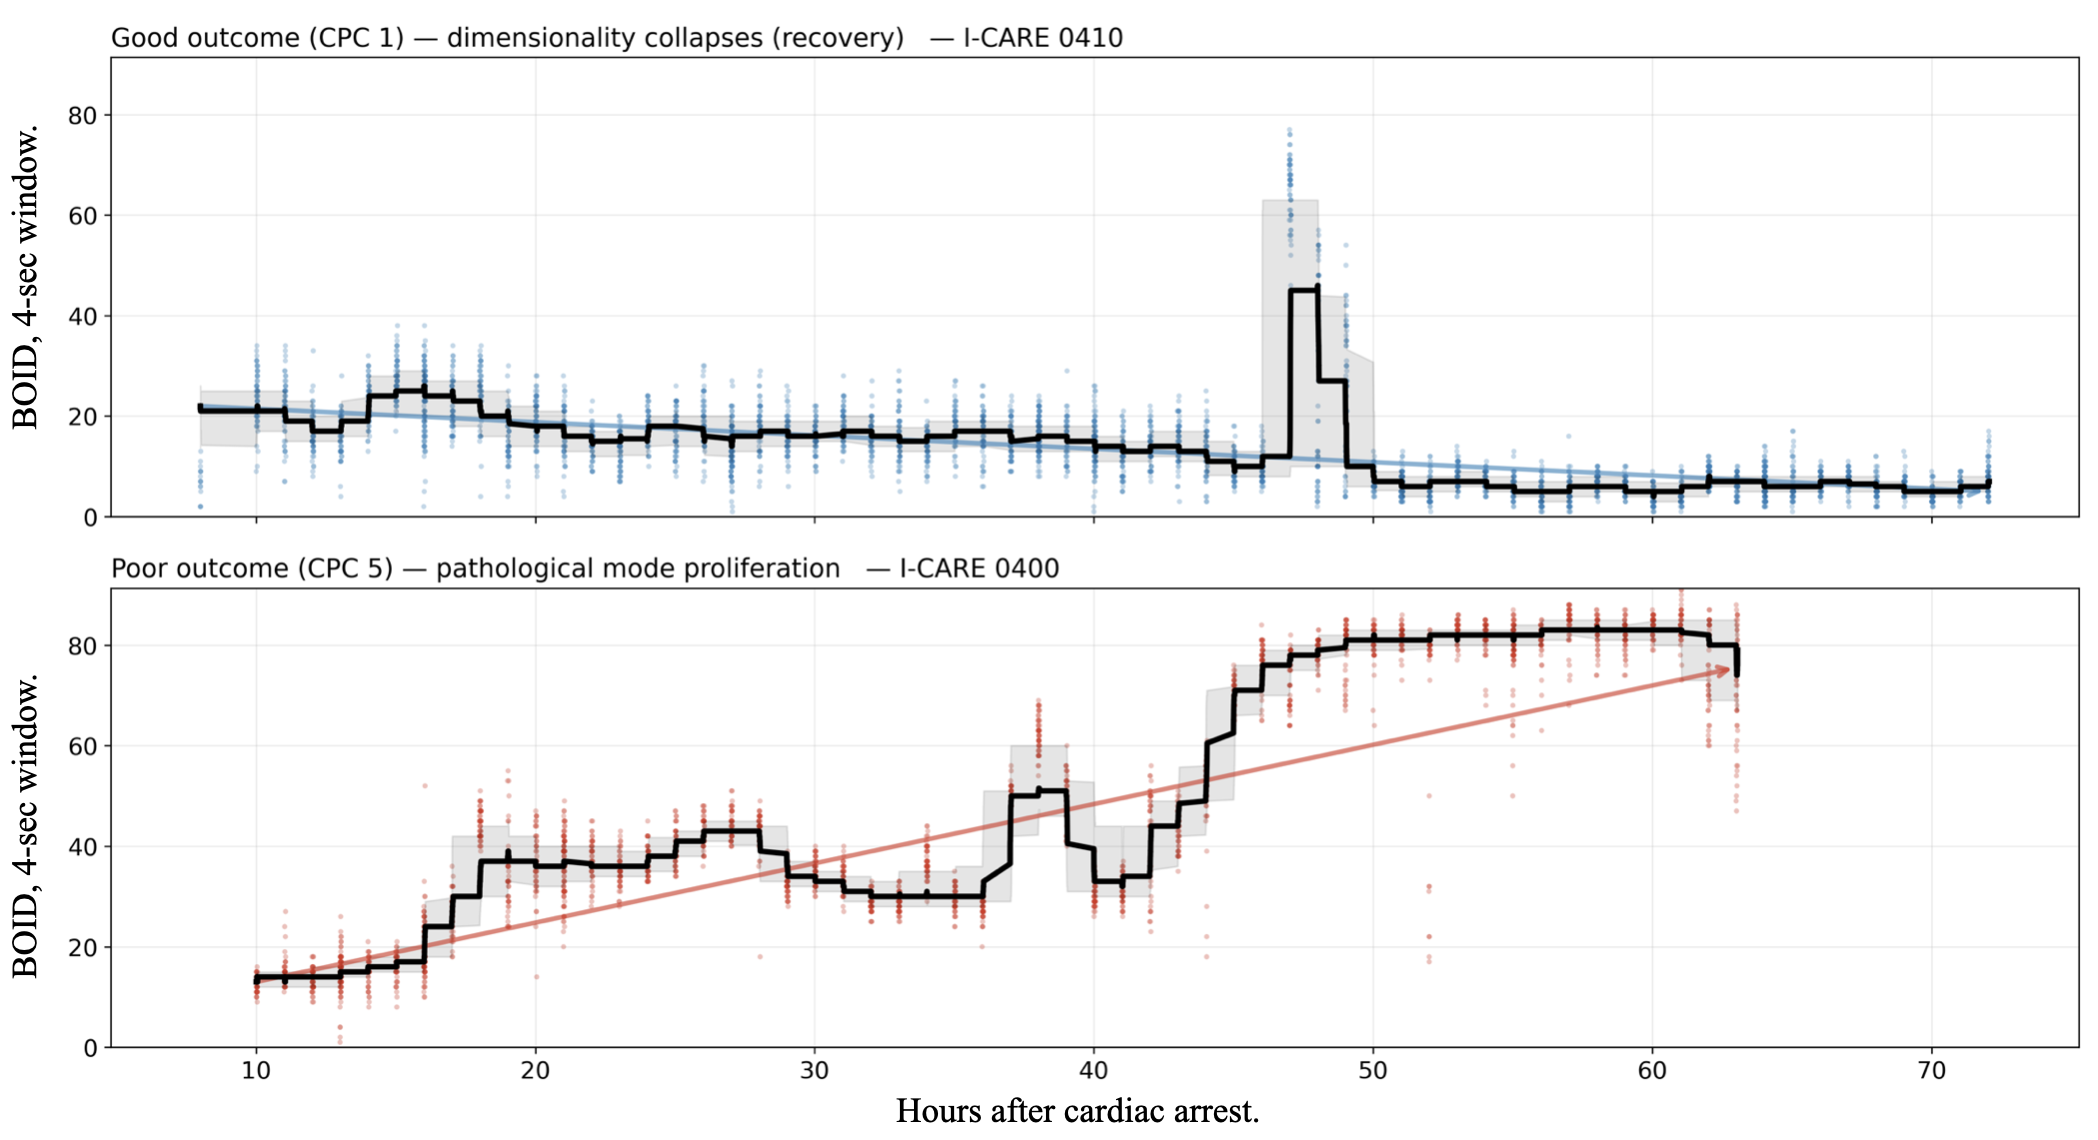
Healthy sleep and propofol sedation show that an intact brain can downshift into low-BOID organized states. Acute post-anoxic coma tests what happens when this regulation fails. We analyzed EEG from all available comatose survivors of cardiac arrest in PhysioNet I-CARE [23]: 575 patients and 826 recordings at 24–72 hours post-ROSC (return of spontaneous circulation, ROSC), dichotomized into Good (CPC 1–2) and Poor (CPC 3–5) neurological outcome (Fig. 7).
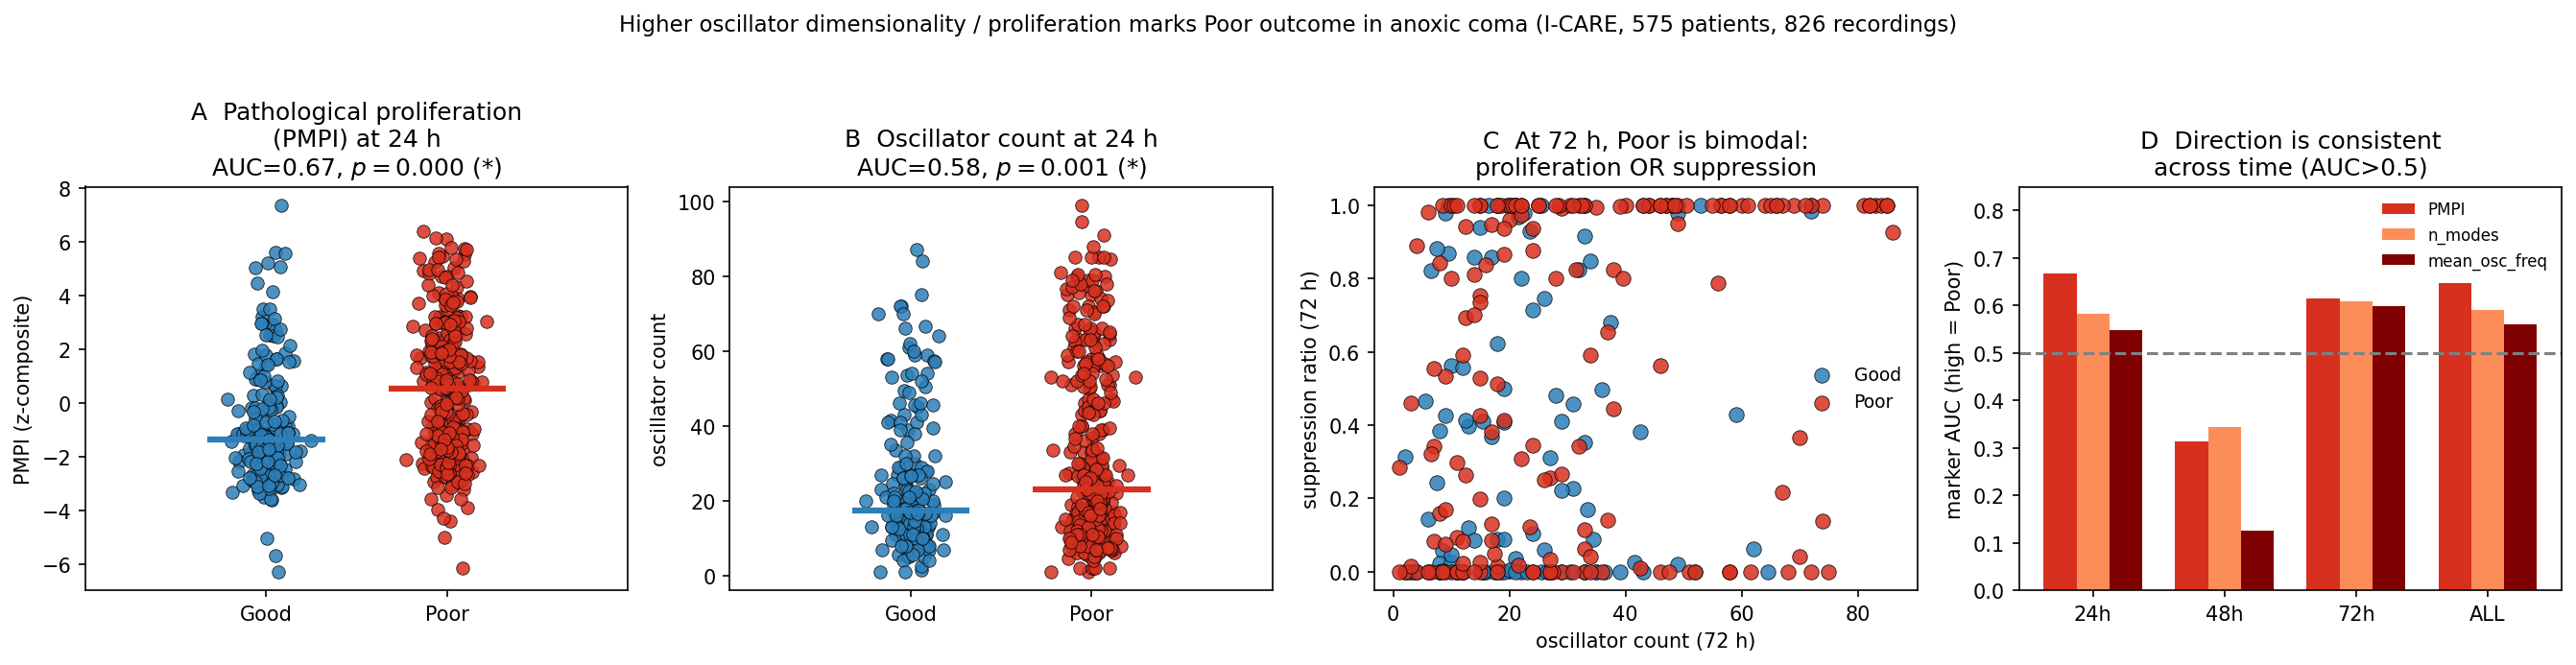
In this injured-brain context, higher BOID marked worse outcome (Fig. 8). The strongest single descriptor was a pre-specified pathological mode-proliferation index (PMPI) combining high mode count, high-frequency poles, burst intermittency, and mode-frequency entropy. At the patient level, PMPI was higher in poor-outcome patients (AUC 0.67, one-sided Mann-Whitney ), as was bare BOID (AUC 0.60, ). The direction was present at both 24 hours and 72 hours.
This is not a contradiction of the sleep and anesthesia results. It is the pathological version of the same switching framework. In healthy physiology, low dimensionality accompanies reversible loss of consciousness and recovery. After anoxic injury, recovery may require the brain to stabilize into a sleep-like low-dimensional unconscious regime before it can re-emerge into high-dimensional conscious activity. Poor-prognosis coma is instead marked by failure of this downshift: the EEG remains high-dimensional because the injured brain is overheated, hyperexcitable, and fragmented. Epileptiform discharges, myoclonus, burst-suppression bursts, and unstable high-frequency poles increase the detected mode count without representing preserved consciousness. Thus, high dimensionality in coma is a poor prognostic sign because it reflects the inability of the injured brain to enter a restorative low-dimensional unconscious state.
BOID contributes to state-of-the-art-level coma prognosis
The descriptor-level coma analysis showed that markers of failed downshifting and pathological overactivation carry partial and complementary outcome information.
We fused four feature families: BOID, the full intrinsic-dimension battery, spectral and burst-suppression descriptors, and routine clinical variables. Models were trained under outcome-stratified, patient-grouped five-fold cross-validation so that no patient contributed to both training and test folds; significance was assessed by patient-level label permutation.
Fusing feature families produced monotone gains (Fig. 9; Table 2). BOID alone reached AUC 0.68. The intrinsic-dimension battery alone reached 0.72. Their combination (BOID + intrinsic-dimension battery) reached 0.75, and adding spectral/burst descriptors reached 0.77 without clinical variables. The full model including clinical variables reached AUC 0.81, balanced accuracy 0.72, Brier score 0.176, and patient-permutation . At a conservative false-positive rate of at most 5%, the fused model identified 33% of poor-outcome patients compared with 10% for the oscillator family alone. The result is best interpreted as an interpretable, state-of-the-art-level prognostic substrate for the failure of dimensional regulation, not as a stand-alone replacement for externally validated clinical EEG prognostication. The ablation shows that BOID makes a nontrivial contribution to the pipeline: it improves when combined with the broader intrinsic-dimension battery and again when fused with spectral, burst-suppression, and clinical variables.
Feature set AUC Bal. acc. Sens.@FPR$\leq$<!-- -->5% Brier
BOID 0.68 0.64 0.10 0.227 Spectral + burst-suppression 0.69 0.64 0.20 0.225 Clinical 0.72 0.68 0.17 0.214 Intrinsic-dimension battery 0.72 0.66 0.19 0.217 Intrinsic-dimension battery + BOID 0.75 0.68 0.23 0.203 Geometry + spectral 0.77 0.70 0.31 0.196 All + clinical 0.81 0.72 0.33 0.176
: Leakage-free coma-outcome prognosis in I-CARE.
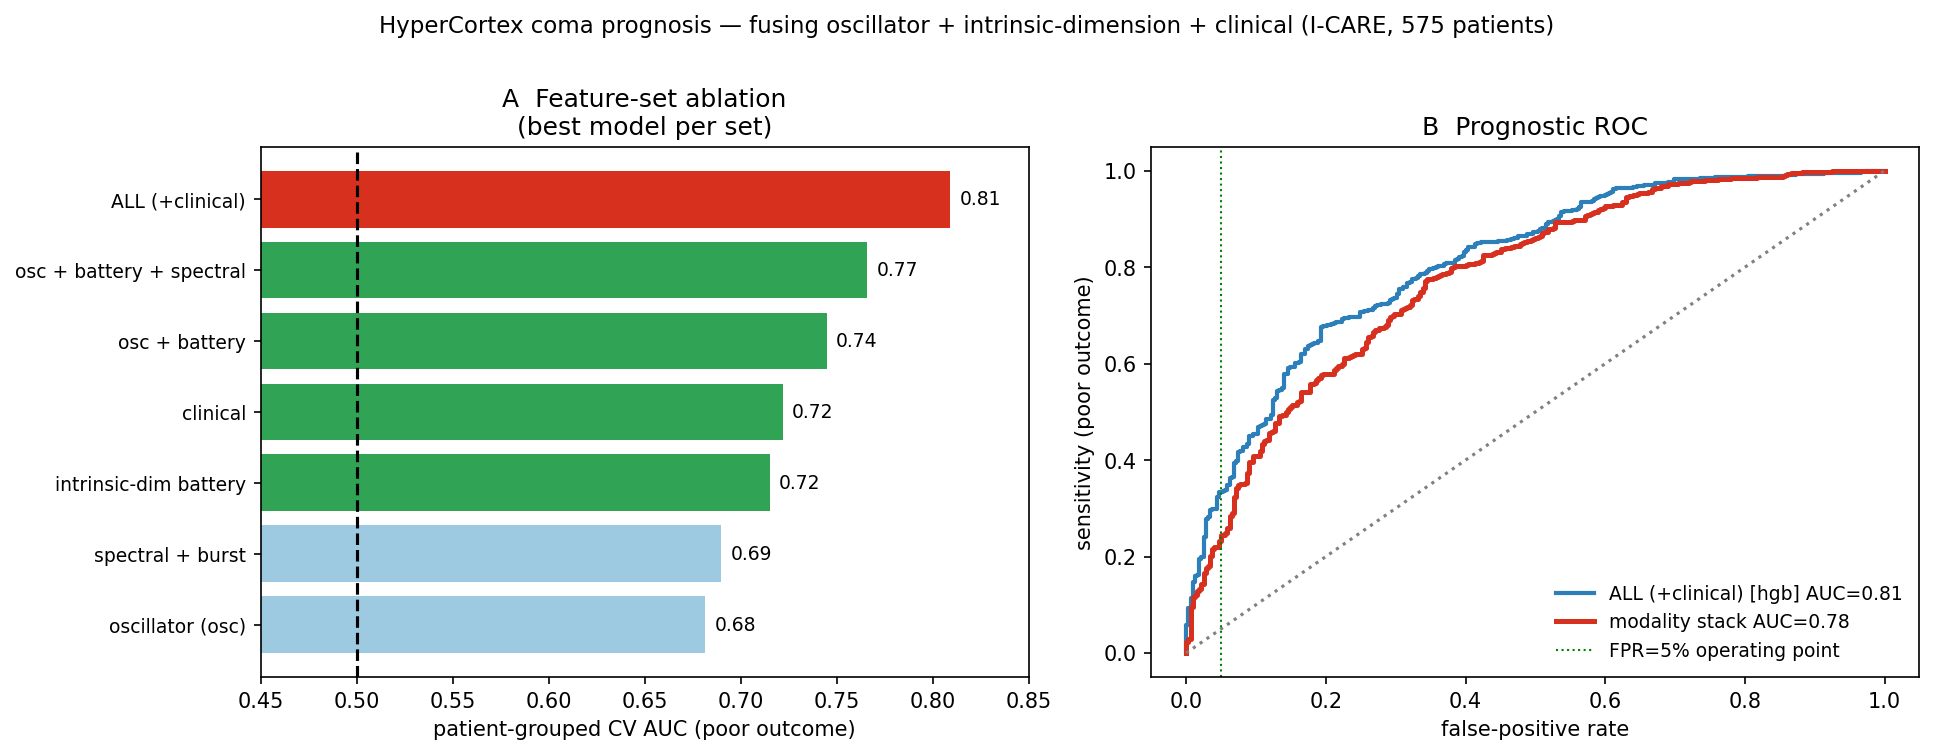
The I-CARE database underlies the George B. Moody PhysioNet/Computing-in-Cardiology Challenge 2023 [24], whose official metric is exactly the sensitivity at a false-positive rate for poor outcome at h that we report, which lets us place our result against the field (Table 3). The leading challenge entries apply deep-network ensembles to many hours of full multichannel EEG together with ECG and clinical data, are tuned for this operating point, and are scored on a hidden test set; they reach – on the metric [24], and canonical deep-learning prognosticators report AUROC – [25]. Our pipeline is deliberately different: it reads only the first few minutes of resting EEG through a transparent, low-dimensional geometric feature set, yet attains AUROC —within the published range—at balanced accuracy . At the aggressive -FPR operating point it reaches , below the deep-network leaders, reflecting both the minimal data it consumes and the absence of operating-point-specific tuning (these numbers are not strictly comparable: ours is patient-grouped cross-validation on the public training subset, theirs a hidden held-out test). The contribution here is therefore not a leaderboard-topping system but an interpretable, data-light marker: it shows that the intrinsic dimensionality of the EEG carries genuine, independent prognostic signal, and it unifies the bedside coma prognosis with the consciousness read-out that the same geometry provides in the intact brain.
Method (input; evaluation) AUROC Sens@FPR$\le$<!-- -->5%
Challenge winner, DL ensemble [24] — 0.79
(72 h multichannel EEG+ECG+clinical; hidden test)
Challenge top-10 [24] (same; hidden test) — 0.60–0.79
Deep CNN [25] (continuous EEG; ext. val.) 0.88–0.90 —
This work (interpretable geometry, 0.81 0.33
<!-- -->4 min EEG+clinical; patient-grouped CV)
: Our fused geometric prognostic against prior work on the I-CARE dataset. The PhysioNet/CinC 2023 Challenge metric is the sensitivity (true-positive rate) at false-positive rate for poor outcome at h [24]—the same metric we report. Deep-network systems trained on hours of full multichannel multimodal data lead the headline metric; our interpretable pipeline, reading only the first minutes of EEG, sits within the published AUROC range while trailing on the high-specificity operating point. Metrics are not strictly comparable across evaluation protocols (internal cross-validation vs hidden test set).
A topology-driven classifier detects regulated state transitions
Finally, we asked whether geometric descriptors jointly decode regulated brain-state transitions. For each window we formed a feature vector combining Hankel-spectral, nearest-neighbor, graph, persistent-homology, and classical fractal descriptors. A gradient-boosted classifier under subject-wise cross-validation separated wakefulness from deep sleep at balanced accuracy 0.98 (AUC 0.99), the five sleep stages at 0.73 against chance 0.20, and awake from sedated propofol recordings at 0.81 (AUC 0.89; Table 4). The poor-prognosis coma contrast was treated separately because the relevant signal is failed regulation and pathological proliferation rather than physiological downshifting.
Contrast classes chance balanced acc. AUC
Sleep, Wake vs. N3 2 0.50 0.98 0.99 Anesthesia, awake vs. sedated 2 0.50 0.81 0.89 Sleep, five stages 5 0.20 0.73 –
: Subject-wise decoding of brain state from the geometric/topological feature vector.
Discussion
We introduced the Brain Oscillator Intrinsic Dimension (BOID) of time series based on Bernadotte Brain Signal Model. We showed BOID is a measurable marker of consciousness, mental effort, recovery mode, and pathological failure of recovery. The first result is direct: conscious wakefulness is higher-dimensional than deep sleep, and the BOID collapses as the healthy brain descends through N1, N2, and N3. The same low-dimensional sleep state appears in mouse non-REM sleep, suggesting that low-dimensional unconscious recovery is conserved across mammals. Propofol anesthesia reproduces the reduction pharmacologically. These convergent results support the interpretation that high BOID is a marker of conscious, resource-demanding brain activity.
The second result is equally important: low BOID is not bad. In healthy physiology, low BOID is a recovery mode. Deep sleep, sedation, and expert meditative stabilization all reduce the number of active oscillatory degrees of freedom, but they do so in organized, reversible, and potentially restorative ways. The conscious repertoire narrows, mental load decreases, and the brain enters a slower, more synchronized, lower-resource state from which high-dimensional activity can later re-emerge. Healthy consciousness is therefore not maximal dimensionality at all times; it is the capacity to alternate between high-dimensional engagement and low-dimensional recovery.
Meditation provides the strongest dissociation between low dimensionality and pathology. Expert meditators show lower BOID than novices, suggesting that trained mental activity requires fewer dynamical resources. Professional or highly trained brains may perform specialized activity with a lower BOID cost. In this sense, expert meditation is a low-BOID waking efficiency mode is a special state of the brain that resembles sleep-like stabilization without ordinary sleep. High dimension marks mental tension and resource expenditure; expertise reduces the cost of control.
Coma reveals the pathological boundary of the same principle. Poor-prognosis post-anoxic coma is characterized by persistently high BOID and elevated PMPI. This does not mean that the patient remains consciously high-dimensional. It means that the injured brain is unable to downshift into the low-dimensional recovery mode. Instead, it remains in an overheated, hyperexcitable, fragmented, high-dimensional regime involving burst intermittency, epileptiform activity, high-frequency poles, myoclonus, and mode-frequency entropy. The poor prognostic sign is therefore not unconsciousness itself, but failed entry into restorative low-dimensional unconscious dynamics.
This distinction prevents a naive reading of neural complexity. In the healthy brain, high dimension reflects conscious engagement; in the sleeping or anesthetized healthy brain, low BOID reflects recovery; in expert meditation, low BOID reflects efficient control; and in acute injury, high BOID reflects pathological overactivation. A single mathematical observable can therefore have different biological meanings depending on tissue integrity and state context. The relevant principle is not “more dimension is better,” but regulated dimensional switching.
The prognostic pipeline extends this principle clinically. In the I-CARE cohort, BOID and PMPI were significant single-marker predictors of poor outcome, and their contribution persisted in a multimodal pipeline. Fusing BOID features with the full intrinsic-dimension battery, spectral/burst descriptors, and routine clinical variables yielded AUC 0.81 under leakage-free patient-grouped validation. This performance should be interpreted carefully until external and hospital-wise validation are completed, but the ablation demonstrates that the new BOID contributes meaningful information to coma-outcome prediction.
The framework connects neural manifold analysis, delay embedding, MSSA, ESPRIT pole extraction, topological data analysis, and Bernadotte oscillatory brain signal models. Spectral methods describe which frequencies are active. Connectivity methods describe relationships between channels. BOID describes how many active oscillatory degrees of freedom are needed to generate the trajectory. Topology describes how those degrees of freedom are organized. Together they provide an interpretable geometric layer for brain-state analysis.
Several limitations remain. BOID estimates depend on preprocessing, window length, sampling rate, montage, noise level, and estimator assumptions. The coma model was internally validated and requires prospective, multicenter, hospital-wise validation and direct comparison with established quantitative EEG prognosticators and PhysioNet Challenge operating metrics. The meditation sample was modest, and expertise effects may be influenced by movement or arousal. Future work should test whether oscillator-dimensionality trajectories predict transitions within individuals, whether low-dimensional sleep-like organization after injury predicts recovery, and whether the same switching principle generalizes to intracranial and multimodal recordings.
Cardiac-arrest coma offers a stringent and cautionary test of any EEG marker. Automated prognosis has become a benchmark task on which deep networks report areas under the ROC curve of – [25, 26], yet these figures are hard to compare and easy to over-read. They rest on heterogeneous and often permissive protocols: many hours of recording, manually curated artifact-free epochs, single train–test splits, or cross-validation that does not hold patients out; and the same architectures degrade sharply off-distribution [27]. More fundamentally, the label is partly endogenous: in these cohorts a poor outcome is frequently death following withdrawal of life-sustaining treatment, a decision that is itself informed by the EEG, so that any such model partly predicts clinical behaviour rather than neurobiology. The field thus carries a persistent gap between leaderboard performance and clinical transfer, in which high accuracy and low interpretability tend to travel together. We take the opposite stance. Rather than maximise a number on curated data, we ask whether a single, transparent geometric property of the signal (its intrinsic dimensionality) carries genuine, independent prognostic information when evaluated conservatively (patient-grouped cross-validation, no epoch curation, only the first minutes of a standard -channel recording) and reported with its confounds made explicit. That the same geometry also indexes the level of consciousness in the intact brain is, we argue, the deeper point: one read-out that spans sleep, anaesthesia, and coma.
Materials and Methods
Brain time-series datasets
We analyzed open brain time-series datasets that together span the range of conscious states, from alert wakefulness through graded loss of consciousness to the injured brain after cardiac arrest (Table [tab:datasets]). These comprised whole-night human polysomnography with expert sleep-stage annotations (Sleep-EDF Expanded), polysomnographic mouse sleep providing a cross-species replication (OpenNeuro ds006366), propofol anaesthesia with repeated behavioural awakenings that dissociate the presence and absence of experience (OpenNeuro ds005620), expert-versus-novice focused-attention meditation (OpenNeuro ds001787), and continuous EEG from comatose survivors of cardiac arrest dichotomised by neurological outcome (PhysioNet I-CARE). The goal was not to build a single diagnostic model, but to test whether intrinsic dimension behaves as a general geometric marker of the level of consciousness across physiologically and pathologically distinct routes to its loss.
::: table* Dataset Modality Conditions
Sleep-EDF Expanded [28] Human PSG/EEG Wake / N1 / N2 / N3 / REM (n = 10 subjects) OpenNeuro ds006366 [20] Mouse PSG/EEG Wake / NREM / REM (cross-species replication) OpenNeuro ds005620 [21] EEG Awake vs. propofol-sedated (repeated awakenings) OpenNeuro ds001787 [22] EEG Expert meditators (n = 12) Novice meditators (n = 12) PhysioNet I-CARE [23] Continuous EEG Comatose post-cardiac-arrest; Good vs. Poor outcome (n = 575, 24–72 h) :::
Brain time series representation
Let
be a multichannel brain time series, where is the number of channels, sensors, electrodes, or regions of interest. For discrete recordings, we write
Each recording is divided into windows
where is the window length.
Hankel-delay embedding
For each multichannel signal , we constructed delay vectors
The set of all such vectors forms the reconstructed trajectory
Equivalently, the embedded signal is represented by a block-Hankel matrix , whose columns are delay vectors. The intrinsic dimension of the brain time series is defined as the intrinsic dimension of this reconstructed trajectory [4, 5, 6].
Brain Oscillators Intrinsic Dimension in the Bernadotte oscillator model
We estimate the intrinsic dimension of brain signals within the Bernadotte oscillator model. In this model, observed neural activity is represented as a finite superposition of latent exposinusoidal components introduced by Bernadotte [4, 5, 6]. Each component corresponds to an active neural mode with its own frequency, phase, damping or growth coefficient, and spatial projection. A brain time series is therefore not treated as an arbitrary stochastic process, but as a structured signal generated by a finite system of exposinusoidal oscillatory degrees of freedom.
A multichannel brain signal is modeled as
where is the spatial pattern of the -th mode, is its frequency, is a damping or growth parameter, is its phase, and denotes noise or unresolved activity.
The intrinsic dimension of the reconstructed brain trajectory is defined as the effective number of dynamically independent exposinusoidal components required to represent the signal [4, 5, 6]. This concept of brain-signal intrinsic dimension was introduced by Bernadotte and is operationalized here using Hankel-delay embeddings and algorithms for estimating the number of active components in brain-computer interface signals [8, 4]. The computational EEG/BCI implementation is further aligned with the lightweight Hankel-embedded pipeline by Menshikov, Elfimov, and Bernadotte [5, 6]. Thus, in the proposed framework, the intrinsic dimension of a brain signal is estimated as the number of active exposinusoidal degrees of freedom generating the observed neural dynamics.
Preprocessing and windowing
Across datasets we used a deliberately light, uniform preprocessing so that within-dataset contrasts reflect dynamics rather than analysis choices. Each recording was restricted to its EEG channels (the standard 10–20 montage where available; the single cortical EEG channel for the mouse data), band-pass filtered to – Hz, and resampled to Hz ( Hz for the mouse recordings, supplied at that rate). Recordings were segmented into non-overlapping epochs— s for the oscillator and frequency analyses, s for the sleep singular-spectrum descriptors—and each epoch was treated as one window and embedded independently. Flat or non-finite channels were dropped, and epochs with non-finite samples or near-zero variance were skipped. Every window-level descriptor was reduced to a per-recording or per-subject median before statistical comparison; only within-dataset gradients are interpreted, because absolute values depend on montage, window length and sampling rate.
MSSA front-end and ESPRIT oscillator extraction
The oscillator descriptors—the count and frequencies that carry most of the paper—are produced by a multichannel singular spectrum analysis (MSSA) front-end followed by ESPRIT pole extraction. Each window is block-Hankel embedded with lag and all channels stacked, and the trajectory matrix is decomposed by SVD; the signal-subspace rank is selected by a energy criterion on the singular values. ESPRIT exploits the lag shift-invariance of the block-Hankel row layout: dropping the last and the first lag-block of the leading left singular vectors yields two subspaces related by the diagonal of poles, with , recovered by total least squares. The complex poles give each mode’s frequency , damping , and per-channel complex amplitude .
The oscillator count is the number of recovered poles with positive frequency in – Hz; under conjugate pairing the implied number of real oscillatory modes is . From the modes we form the oscillator-family descriptors used throughout: the power-weighted () median and mean oscillator frequency; the fraction of oscillatory power in the delta, theta, alpha and beta bands and above Hz; and the Shannon entropies of the mode-frequency and mode-power distributions. As a surrogate-thresholded alternative we also compute an oscillatory dimension , the size of the leading block of singular values of that exceed a null built from independent per-channel temporal shuffles of the window; a temporal-shuffle null is required because phase-randomisation preserves the autocovariance and hence the entire Hankel spectrum.
Hankel spectral rank
For each Hankel matrix , we computed the singular value decomposition
From the singular values , we computed effective Hankel rank, energy rank, participation ratio, entropy rank, and stable rank:
These quantities provide linear estimates of the effective number of active Hankel components.
Additional intrinsic dimension estimators
To avoid relying on a single estimator, we also computed nearest-neighbor and graph-based intrinsic dimension estimates, including the Levina–Bickel maximum likelihood estimator, TwoNN estimator, minimum-spanning-tree scaling estimators, and the Brito–Quiroz–Yukich MST-degree estimator [16, 17, 18, 19].
For each embedded point , let be the Euclidean distance to its -th nearest neighbor. The local Levina–Bickel estimate for neighborhood size is
The global estimate is obtained by averaging over embedded points and, where applicable, over a range of neighborhood sizes.
Agreement among estimators was interpreted as evidence for stable manifold-like structure. Disagreement was treated as a potential marker of nonstationarity, fragmentation, or departure from smooth low-dimensional dynamics.
Classic fractal estimators
As a check independent of the singular spectrum we additionally computed three established estimators. The Grassberger–Procaccia correlation dimension is the scaling exponent of the correlation integral , estimated as the slope of versus over the lower-middle of the pairwise-distance distribution [29]. The false-nearest-neighbour embedding dimension is the smallest delay-embedding dimension at which the fraction of neighbours that separate on extending the embedding falls below a tolerance, computed per channel and averaged. The Higuchi fractal dimension is the slope of versus for the curve length of the series sub-sampled at lag , again per channel and averaged. Because the correlation dimension acts on the multichannel delay embedding while the false-nearest-neighbour and Higuchi estimators act on the raw single-channel signals, their agreement with the spectral and graph estimators provides convergent evidence independent of the Hankel construction. The estimator-dispersion index is the inter-quartile range across the scalar estimators and is itself reported as a state descriptor.
Topological descriptors
We computed persistent homology of reconstructed Hankel-delay trajectories using Vietoris–Rips filtrations. For each trajectory, we extracted and persistence diagrams, persistence entropy, the number of long-lived features, and vectorized topological summaries.
For a persistence diagram
we define lifetimes
and persistence entropy
The topological interpretation is direct: dominant oscillations produce loop-like structures; multiple oscillatory modes produce more complex cyclic structures; fragmentation or switching produces altered connected components and persistence patterns.
Discriminative-subspace classifier: topological separation of time series by class projectors
Each multichannel recording was represented by the -dimensional signal subspace of its block-Hankel trajectory. For each outcome class, we computed the extrinsic Grassmann mean of the training members’ subspace projectors,
The class-separation operator
is symmetric, with eigenvalues in . Empirically, most of its spectrum formed a near-zero shared bulk, whereas a small number of extreme eigenvectors captured directions that separated the two classes. We therefore retained the eigenvectors with largest absolute eigenvalues, defining the discriminative subspace , and discarded the shared bulk.
A query recording was scored by the signed energy of its own Hankel subspace within these discriminative directions:
where . The sign and magnitude of quantify whether the recording projects more strongly onto Good- or Poor-associated characteristic directions. Taking to full rank recovers the plain subspace-distance classifier of [4]; finite restricts the classifier to the discriminative directions and removes the large shared component of the two classes. (Algorithm [alg:discsub]).
Parameters and evaluation
The embedding window was fixed at throughout. The signal-subspace rank and discriminant dimension were the only tuned hyperparameters. The classifier was evaluated on comatose patients ( Good / Poor; one -h recording per patient) under leakage-free, patient-grouped cross-validation. To exclude model-selection and out-of-fold leakage, was rebuilt using training patients only, and were re-selected by inner cross-validation within each outer fold. A label-permuted shuffled-score control collapsed performance to chance.
On its own, the discriminative-subspace classifier reached AUROC with best performance at and –. When added to the intrinsic-dimension battery and clinical-feature fusion, it contributed a verified AUROC improvement in 30-seed repeated cross-validation.
Algorithm — Discriminative-subspace classifier (top-k projector difference).
Input:  labelled multichannel series {(X_i, y_i)}, y_i in {A, B};
        embedding lag L; subspace rank r; discriminant dimension k

Subspace(X, r):                       # signal subspace of one recording
    H    <- block-Hankel embedding of X, lag L
    Cov  <- (1/(N-L+1)) * H H^T
    return U_r(Cov)                   # top-r left singular vectors

Train:                                # build the discriminant subspace
    for all i:        U_i <- Subspace(X_i, r)
    for each class c: P_c <- (1/|I_c|) sum_{i in I_c} U_i U_i^T
    Delta <- P_A - P_B
    (lambda_j, w_j) <- eig(Delta); keep the k pairs of largest |lambda_j|

Classify query X*:
    U*  <- Subspace(X*, r)
    s   <- sum_{j=1..k} lambda_j ||w_j^T U*||_F^2  =  Tr(U*^T Delta_k U*)
    return A if s > tau else B
Topology-driven classifier
For each window , we constructed a feature vector
where collects the nearest-neighbour, graph and fractal intrinsic-dimension estimates, the singular-spectrum descriptors, the persistent-homology summaries, and additional trajectory-geometry features (no raw band power or amplitudes enter ). The classifier is a histogram gradient-boosting model with balanced class weights, evaluated under -fold cross-validation grouped by subject (GroupKFold), so that no subject contributes windows to both the training and the test fold. We report balanced accuracy, macro-, and (for binary contrasts) the ROC-AUC, with chance level , together with permutation feature importance. For the I-CARE coma data the outcome label is per patient, and all patients with a usable and/or h recording were analysed (the first s of each, partially streamed). We tested whether higher oscillator dimensionality marks poor outcome in two ways: (i) for each marker—the oscillator count, the mean oscillator frequency, and a pre-specified pathological mode-proliferation index (PMPI , -scored within each timepoint)—we report the discrimination AUC for predicting Poor and a one-sided Mann–Whitney test; and (ii) a leakage-free, patient-grouped cross-validated logistic classifier (standardised features, GroupKFold so no patient is split across folds) over the oscillator count, PMPI and frequency descriptors, whose significance was assessed by a patient-level label-permutation test ( permutations reassigning Good/Poor across patients, two-sided on ). For the fused prognostic pipeline (Sec. [sec:coma-sota]) we grouped the per-recording features into four families—oscillator, the full intrinsic-dimension battery (Levina–Bickel MLE, TwoNN, correlation dimension, false-nearest-neighbours, MST-length, BQY-degree, persistent-homology , effective/stable rank, Higuchi, estimator dispersion), spectral/burst-suppression, and clinical—and trained, for each family and each union, both a histogram gradient-boosting classifier and an -regularised logistic model under outcome-stratified patient-grouped five-fold cross-validation (StratifiedGroupKFold); we report the better model per feature set, scored by ROC-AUC, balanced accuracy, sensitivity at a false-positive rate , and the Brier score, with a -fold patient-level permutation test on the winner and on a three-modality out-of-fold stacked ensemble.
Statistical analysis and classification
All descriptor comparisons were performed on subject-level (or patient-level) medians, to avoid inflated significance from many correlated windows. Differences across more than two physiological states used the Kruskal–Wallis test across groups (the Friedman test for the within-subject sleep-stage design); within-subject two-condition contrasts (rest vs. task, awake vs. sedated) used the paired Wilcoxon signed-rank test; two-group contrasts (Good vs. Poor outcome, expert vs. novice) used the Mann–Whitney test; and ordinal associations (with the CPC score) used the Spearman correlation. -values are reported per descriptor; where a family of descriptors was screened this is stated, and only the strongest effects survive an informal multiplicity correction. All cross-validation is grouped by subject or patient (no leakage), and significance of cross-validated decoding was, where stated, assessed by label permutation respecting the grouping.
Algorithmic summary
:::: algorithm ::: algorithmic Multichannel brain time series , labels , embedding length , delay Intrinsic dimension estimates, topological descriptors, brain-state classifier Preprocess and normalize multichannel recording Segment recording into windows Construct Hankel-delay trajectory Compute SVD of the Hankel matrix Estimate , , Estimate nearest-neighbor and graph-based intrinsic dimension Compute persistent homology descriptors Build feature vector Aggregate descriptors at subject and condition levels Test group differences in intrinsic dimension and topology Train topology-driven classifier with subject-wise cross-validation Report statistical effects, estimator agreement, and classification performance ::: ::::
Data and materials availability
All datasets analyzed in this study are publicly available through PhysioNet or OpenNeuro.
Code for Hankel-delay embedding, oscillator extraction, intrinsic-dimension estimation, and topological analysis will be made available in a public repository upon publication.
Funding information
The research was founded by Aicumene Inc.
Competing interests
The authors declare no competing interests, or the appropriate statement should be inserted here.
Supplement
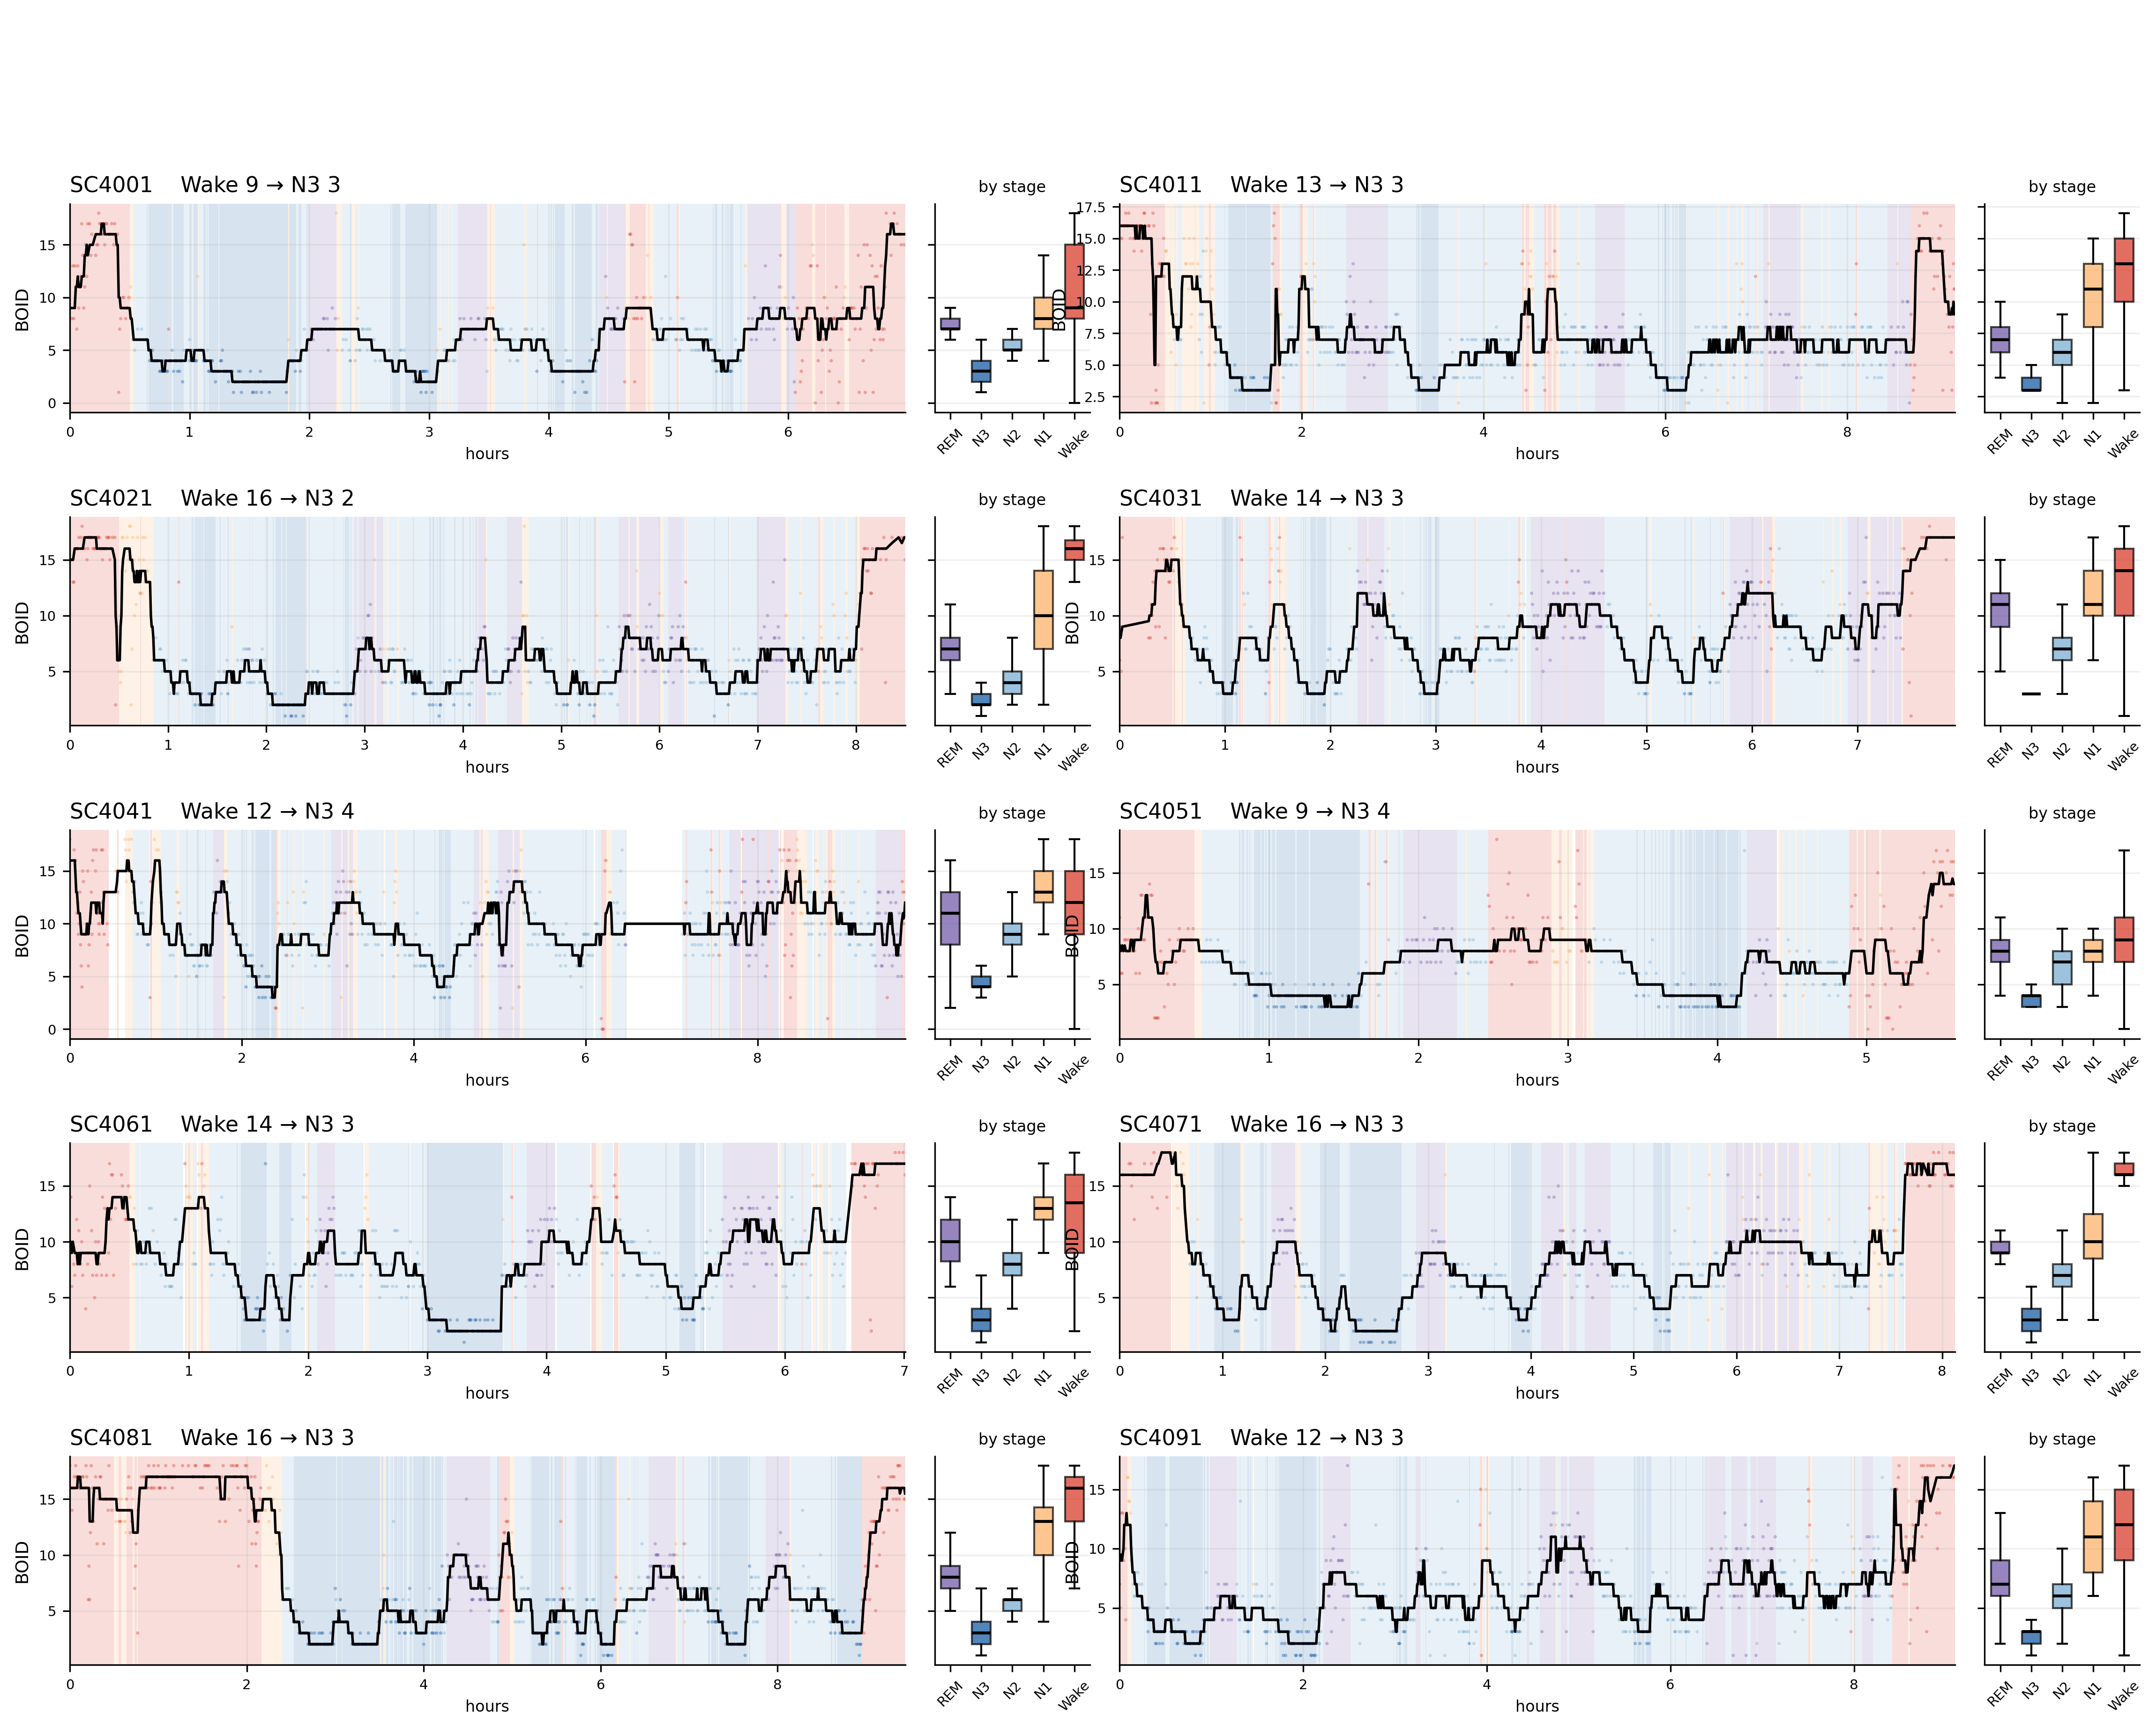
Within-subject reproducibility of sleep-related dimensional downshifting.
To verify that the sleep-depth effect was not driven by a single subject or by pooled-window statistics, we visualized whole-night BOID trajectories for each Sleep-EDF recording in the analyzed sample. In nearly all recordings, BOID was highest during wakefulness and lowest during N3 slow-wave sleep, with N1, N2, and REM occupying intermediate ranges. The running median followed the hypnogram over the night: dimensionality decreased during transitions into deeper NREM sleep and increased again during REM or wake transitions. This subject-level montage confirms that the reduction of BOID with sleep depth is reproducible across individuals and reflects a within-brain state transition from high-dimensional wakefulness to low-dimensional sleep recovery mode.
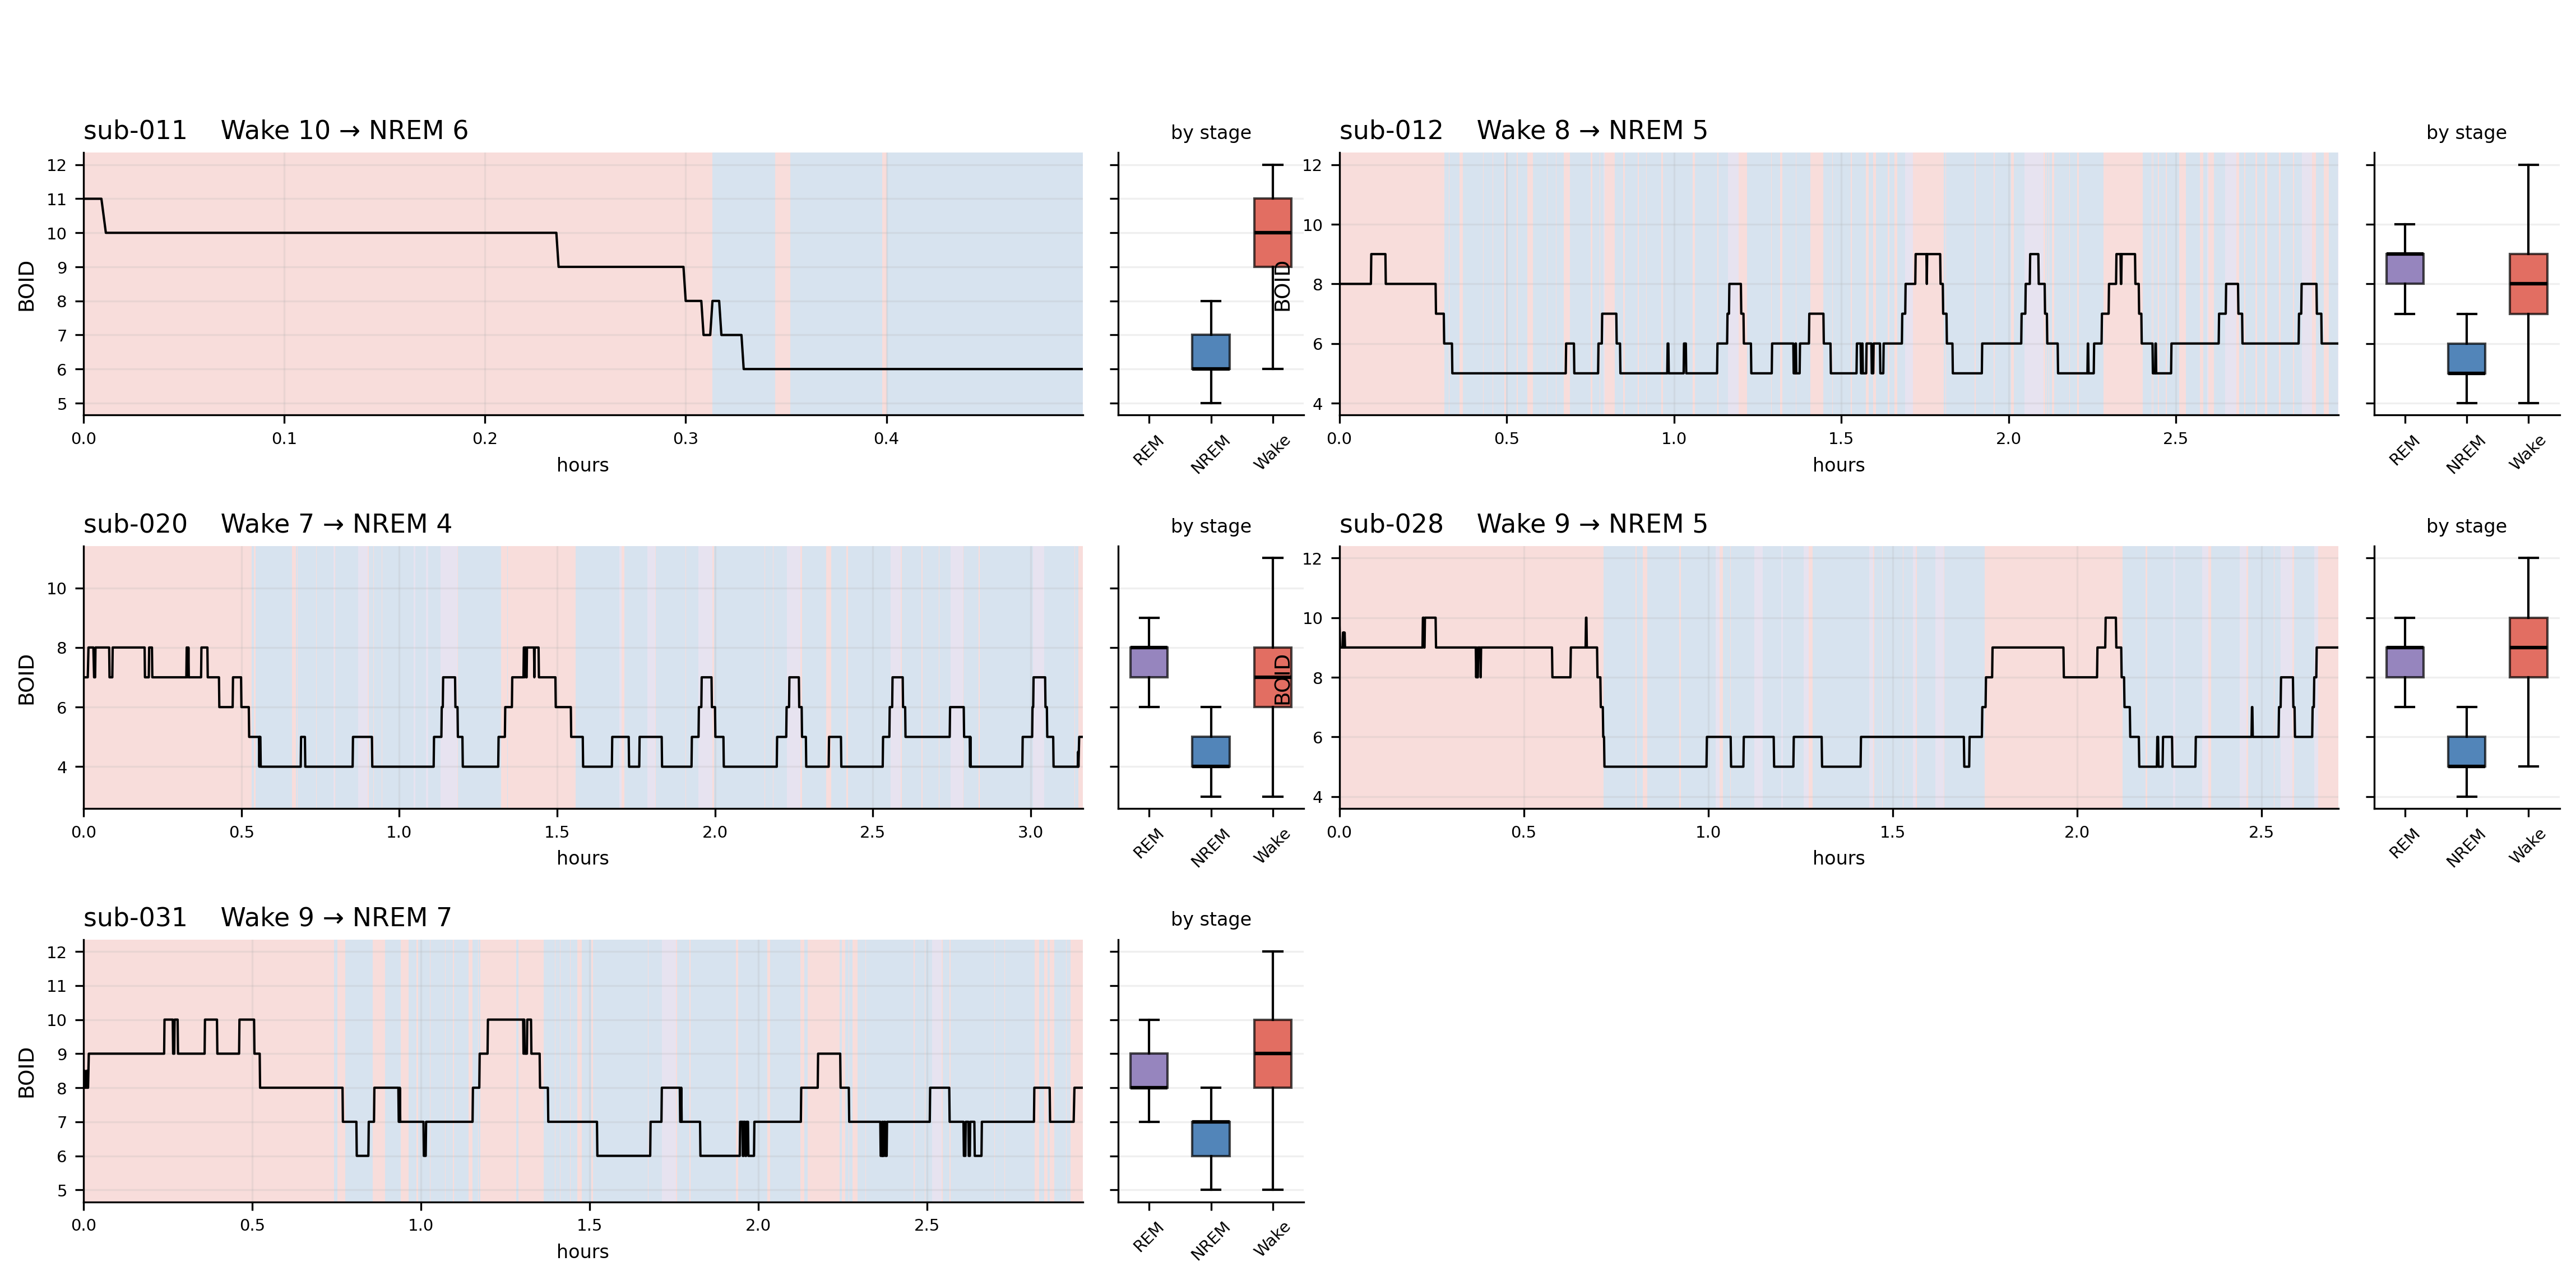
Individual-animal reproducibility of mouse sleep dimensional downshifting.
To verify that the mouse sleep effect was not driven by pooled epochs or a small number of animals, we visualized BOID trajectories separately for individual mice. Across recordings, non-REM sleep was associated with lower BOID than wakefulness, while REM generally occupied an intermediate or higher-dimensional regime. The within-animal boxplots reproduced the group-level ordering, and the time-resolved traces showed BOID decreasing during sustained non-REM periods and increasing during transitions back toward wakefulness or REM. These individual-animal trajectories support the conclusion that low-dimensional non-REM sleep is a conserved recovery-mode state across mammalian sleep.
::: thebibliography 36 J. A. Gallego et al., Neural manifolds for the control of movement. Neuron 94, 978–984 (2017). doi:10.1016/j.neuron.2017.05.025. M. Jazayeri, S. Ostojic, Interpreting neural computations by examining intrinsic and embedding dimensionality of neural activity. Curr. Opin. Neurobiol. 70, 113–120 (2021). doi:10.1016/j.conb.2021.08.002. R. Chaudhuri et al., The intrinsic attractor manifold and population dynamics of a canonical cognitive circuit across waking and sleep. Nat. Neurosci. 22, 1512–1520 (2019). doi:10.1038/s41593-019-0460-x. J. Rue-Queralt et al., Decoding brain states on the intrinsic manifold of human brain dynamics across wakefulness and sleep. Commun. Biol. 4, 854 (2021). doi:10.1038/s42003-021-02369-7.
V. M. Buchstaber, Time series analysis and Grassmannians. Amer. Math. Soc. Transl. 162, 1–17 (1994).
A. Bernadotte, Topology-driven classification of time series. bioRxiv (2026). doi:10.64898/2026.04.25.720787.
A. Bernadotte, V. Buchstaber, Method for evaluating the number of signal sources and application to non-invasive brain-computer interface. arXiv:2410.11844 (2024). doi:10.48550/arXiv.2410.11844.
I. Menshikov, N. Elfimov, A. Bernadotte, A lightweight Hankel-embedded pipeline for real-time EEG filtering and classification. Proc. ICARA, 589–593 (2026). doi:10.1109/ICARA69401.2026.11480292.
A. Bernadotte, Estimating the number of sources in EEG with Hankel embedding for brain-computer interface. Proc. ICARA, 621–626 (2026). doi:10.1109/ICARA69401.2026.11480398.
F. Takens, Detecting strange attractors in turbulence. In Dynamical Systems and Turbulence, Warwick 1980, Lecture Notes in Mathematics 898, 366–381 (1981). doi:10.1007/BFb0091924. T. Sauer, J. A. Yorke, M. Casdagli, Embedology. J. Stat. Phys. 65, 579–616 (1991). doi:10.1007/BF01053745. E. R. Deyle, G. Sugihara, Generalized theorems for nonlinear state space reconstruction. PLoS ONE 6, e18295 (2011). doi:10.1371/journal.pone.0018295. N. Golyandina, V. Nekrutkin, A. A. Zhigljavsky, Analysis of Time Series Structure: SSA and Related Techniques (Chapman & Hall/CRC, 2001). N. Golyandina, A. Zhigljavsky, Singular Spectrum Analysis for Time Series (Springer, 2013). doi:10.1007/978-3-662-62436-4. A. Zhigljavsky, Singular Spectrum Analysis for time series. Stat. Interface 3, 255–258 (2010). doi:10.4310/SII.2010.v3.n3.a1. P. Grassberger, I. Procaccia, Characterization of strange attractors. Phys. Rev. Lett. 50, 346–349 (1983). doi:10.1103/PhysRevLett.50.346. T. Takahashi, Complexity of spontaneous brain activity in mental disorders. Prog. Neuropsychopharmacol. Biol. Psychiatry 45, 258–266 (2013). doi:10.1016/j.pnpbp.2012.05.001. J. Jeong, EEG dynamics in patients with Alzheimer’s disease. Clin. Neurophysiol. 115, 1490–1505 (2004). doi:10.1016/j.clinph.2004.01.001. C. J. Stam, Nonlinear dynamical analysis of EEG and MEG. Clin. Neurophysiol. 116, 2266–2301 (2005). doi:10.1016/j.clinph.2005.06.011. H. Edelsbrunner, D. Letscher, A. Zomorodian, Topological persistence and simplification. Discrete Comput. Geom. 28, 511–533 (2002). doi:10.1007/s00454-002-2885-2. G. Carlsson, Topology and data. Bull. Amer. Math. Soc. 46, 255–308 (2009). doi:10.1090/S0273-0979-09-01249-X. Z. Liu et al., Persistent homology-based topological analysis on the Gestalt patterns during human brain cognition process. Comput. Intell. Neurosci. 2334332 (2021). doi:10.1155/2021/2334332. F. Nasrin et al., Bayesian topological learning for brain state classification. Proc. ICMLA, 1029–1036 (2019). doi:10.1109/ICMLA.2019.00172. M. Flammer et al., Persistent homology-based classification of chaotic multi-variate time series: Application to electroencephalograms. SN Comput. Sci. 5, 89 (2023). doi:10.1007/s42979-023-02396-7. K. Prantzalos et al., MaTiLDA: An integrated machine learning and topological data analysis platform for brain network dynamics. Pacific Symposium on Biocomputing 29, 65–80 (2023). I. J. Bajwa et al., A repeated awakening study exploring the capacity of complexity measures to capture dreaming during propofol sedation. Sci. Rep. 15, s41598-025-12695-z (2025). doi:10.1038/s41598-025-12695-z.
E. Amorim et al., The International Cardiac Arrest Research (I-CARE) Consortium electroencephalography database. Crit. Care Med. (2023). Dataset: PhysioNet, doi:10.13026/m33r-bj81.
L. Rose et al., Mouse Sleep Staging Validation dataset and automated sleep staging in mice. SLEEP Advances 6, zpaf025 (2025). doi:10.1093/sleepadvances/zpaf025.
B. Kemp et al., Analysis of a sleep-dependent neuronal feedback loop: the slow-wave microcontinuity of the EEG. IEEE Trans. Biomed. Eng. 47, 1185–1194 (2000). doi:10.1109/10.867928.
A. Delorme and T. Brandmeyer, EEG meditation study. OpenNeuro, dataset ds001787. doi:10.18112/openneuro.ds001787.v1.0.2.
R. Roy, T. Kailath, ESPRIT: Estimation of signal parameters via rotational invariance techniques. IEEE Trans. Acoust. Speech Signal Process. 37, 984–995 (1989). doi:10.1109/29.32276.
E. N. Brown, R. Lydic, and N. D. Schiff, General anesthesia, sleep, and coma. New England Journal of Medicine 363, 2638–2650 (2010). doi:10.1056/NEJMra0808281.
E. Adam et al., Modulatory dynamics mark the transition between anesthetic states of unconsciousness. Proceedings of the National Academy of Sciences 120, e2300058120 (2023). doi:10.1073/pnas.2300058120.
E. Levina and P. J. Bickel, Maximum likelihood estimation of intrinsic dimension. In Advances in Neural Information Processing Systems 17, 777–784 (2005).
E. Facco, M. d’Errico, A. Rodriguez, and A. Laio, Estimating the intrinsic dimension of datasets by a minimal neighborhood information. Scientific Reports 7, 12140 (2017). doi:10.1038/s41598-017-11873-y.
M. R. Brito, A. J. Quiroz, and J. E. Yukich, Intrinsic dimension identification via graph-theoretic methods. Journal of Multivariate Analysis 116, 263–277 (2013). doi:10.1016/j.jmva.2012.12.007.
F. Camastra and A. Staiano, Intrinsic dimension estimation: Advances and open problems. Information Sciences 328, 26–41 (2016). doi:10.1016/j.ins.2015.08.029.
M. A. Reyna, E. Amorim, R. Sameni, J. Weigle, A. Elola, A. Bahrami Rad, S. Seyedi, H. Kwon, W.-L. Zheng, M. M. Ghassemi, M. J. A. M. van Putten, J. Hofmeijer, N. Gaspard, A. Sivaraju, S. T. Herman, J. W. Lee, M. B. Westover, and G. D. Clifford, “Predicting neurological recovery from coma after cardiac arrest: the George B. Moody PhysioNet Challenge 2023,” Computing in Cardiology 50, 1–4 (2023). doi:10.22489/CinC.2023.019.
M. C. Tjepkema-Cloostermans, C. da Silva Lourenço, B. J. Ruijter, S. C. Tromp, G. Drost, F. H. M. Kornips, A. Beishuizen, F. H. Bosch, J. Hofmeijer, and M. J. A. M. van Putten, “Outcome prediction in postanoxic coma with deep learning,” Critical Care Medicine 47, 1424–1432 (2019). doi:10.1097/CCM.0000000000003854.
Y. Kuramoto, Self-entrainment of a population of coupled non-linear oscillators. In International Symposium on Mathematical Problems in Theoretical Physics, Lecture Notes in Physics 39, 420–422 (1975). doi:10.1007/BFb0013365.
J. A. Acebrón, L. L. Bonilla, C. J. Pérez Vicente, F. Ritort, and R. Spigler, The Kuramoto model: A simple paradigm for synchronization phenomena. Reviews of Modern Physics 77, 137–185 (2005). doi:10.1103/RevModPhys.77.137.
E. M. Izhikevich, Simple model of spiking neurons. IEEE Transactions on Neural Networks 14, 1569–1572 (2003). doi:10.1109/TNN.2003.820440.
E. M. Izhikevich, Dynamical Systems in Neuroscience: The Geometry of Excitability and Bursting. MIT Press (2007).
J. Rissanen, Modeling by shortest data description. Automatica 14, 465–471 (1978). doi:10.1016/0005-1098(78)90005-5.
P. D. Grünwald, The Minimum Description Length Principle. MIT Press (2007). doi:10.7551/mitpress/4643.001.0001.
J. Rissanen, Minimum description length. Scholarpedia 3, 6727 (2008). doi:10.4249/scholarpedia.6727. :::
References
- [1] Brown2010AnesthesiaSleepComa
- [2] Adam2023AnestheticStates
- [3] Bernadotte2026TopologyDriven
- [4] Bernadotte2026Topology
- [5] Menshikov2026
- [6] Bernadotte2026EEG
- [7] Buchstaber1994
- [8] BernadotteBuchstaber2024
- [9] RoyKailath1989ESPRIT
- [10] Kuramoto1975
- [11] Acebron2005Kuramoto
- [12] Izhikevich2003
- [13] Izhikevich2007
- [14] Rissanen1978MDL
- [15] Grunwald2007MDL
- [16] LevinaBickel2005
- [17] ref-FaccoTwoNN
- [18] ref-BritoQuirozYukich
- [19] ref-CamastraStaiano
- [20] Rose2025
- [21] Bajwa2025
- [22] DelormeBrandmeyer2018Meditation
- [23] ICARE2023
- [24] ref-cinc2023
- [25] ref-tjepkema2019
- [26] ref-zheng2021
- [27] ref-docreview
- [28] Kemp2000
- [29] Grassberger1983